Table of Contents
Have you ever been unsure of which Technical Indicators to use and felt frustrated? Though it can be frustrating without the proper tools, trading can be interesting at times. Investors can make better decisions about which stocks to buy or sell, as well as when, by using technical indicators. Bid farewell to your confusion and frustration with technical indicators. The most widely used technical indicators are going to be covered in this lesson. Anticipate an improvement in your trade balance.

In trading, and especially in day trading, technical indicators are crucial. More insight into price movements is offered by indicators, which also equip traders with the knowledge they need to spot possible setups and decide which way to trade.
Technical indicators come in hundreds of varieties, but you can begin trading by learning how some of the most widely used ones operate. We’ll go over the benefits of using technical indicators in this guide, along with a list of the top ones for day trading.
What is a Technical Indicator?
All that a technical indicator is, is a formula in mathematics. The majority of technical indicators compute a number using historical price data or other trading-related variables like volume. It is possible to compute the number generated by a technical indicator multiple times for various time intervals and see the results on a chart.

A simple technical indicator would be a moving average, for instance. This determines an asset’s average price over the previous X intervals of time. A series of moving averages back in time can be produced by computing a moving average from the current time, the previous time, and so forth. These moving averages can then be plotted to create a line.
Also Read
Understanding Classic Chart Patterns and Types
Goals of Technical Indicators
In trading, technical indicators have multiple uses.
They first help to make complex data simpler. Although price data alone is frequently disorganized and difficult to understand, technical indicators provide an additional means of condensing and displaying that data. Various technical indicators offer distinct perspectives on the movement of an asset’s price.
Technical indicators can also assist traders in locating important price points, such as zones of resistance or support. In addition, they can spot price points that, while not immediately apparent from a chart, may represent new lows or highs following a breakout or breakdown.
Additionally, traders can use technical indicators to anticipate possible reversals and take action accordingly. Certain indicators help identify resistance zones where a reversal might take place, while other indicators use price momentum to predict the likelihood of a reversal.
Open a Free Demat Account on Zerodha and use Sensibull and Streak for Free
Considerations Before Using Technical Indicators
There are hundreds of different technical indicators available to day traders, and there are countless ways to combine them. The temptation to use as many indicators as possible in your trading may arise from this.
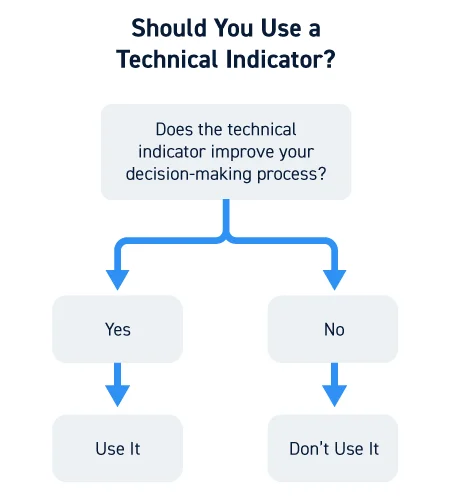
It’s crucial, though, that you don’t use indicators merely because they are accessible. Instead, each technical indicator you employ ought to support the choices you make. Don’t use an indicator if you don’t understand it or if you find that it isn’t assisting you in making trade decisions.
Always keep in mind that every trader uses a different set of indicators. It is up to you to determine which ones work best for your trading approach and enhance rather than detract from your trading.
Also Read
Single CandleStick Patterns & Their Type: Ultimate Guide 2024
Trading Tools for Technical Analysts and Day Traders
Charting tools are used by day traders and technical analysts to detect buying and selling signals as well as market trends and patterns. Technical indicators fall into two major categories in general. They are as follows:
Overlays: Technical indicators that are scaled in line with prices are shown next to price data on a stock chart. These could include Fibonacci lines, moving averages, and Bollinger Bands.
Oscillators: Technical indicators that oscillate between a low point and a high point are shown either above or below the price chart, as opposed to being superimposed on it. RSI, MACD, and stochastic oscillators are a few examples of these.
List of Top 10 Technical Indicators for 2024
1. VWAP
Volume-weighted Average Price, or VWAP, is arguably the most popular technical indicator among day traders. VWAP is helpful since it considers trading volume in addition to price.
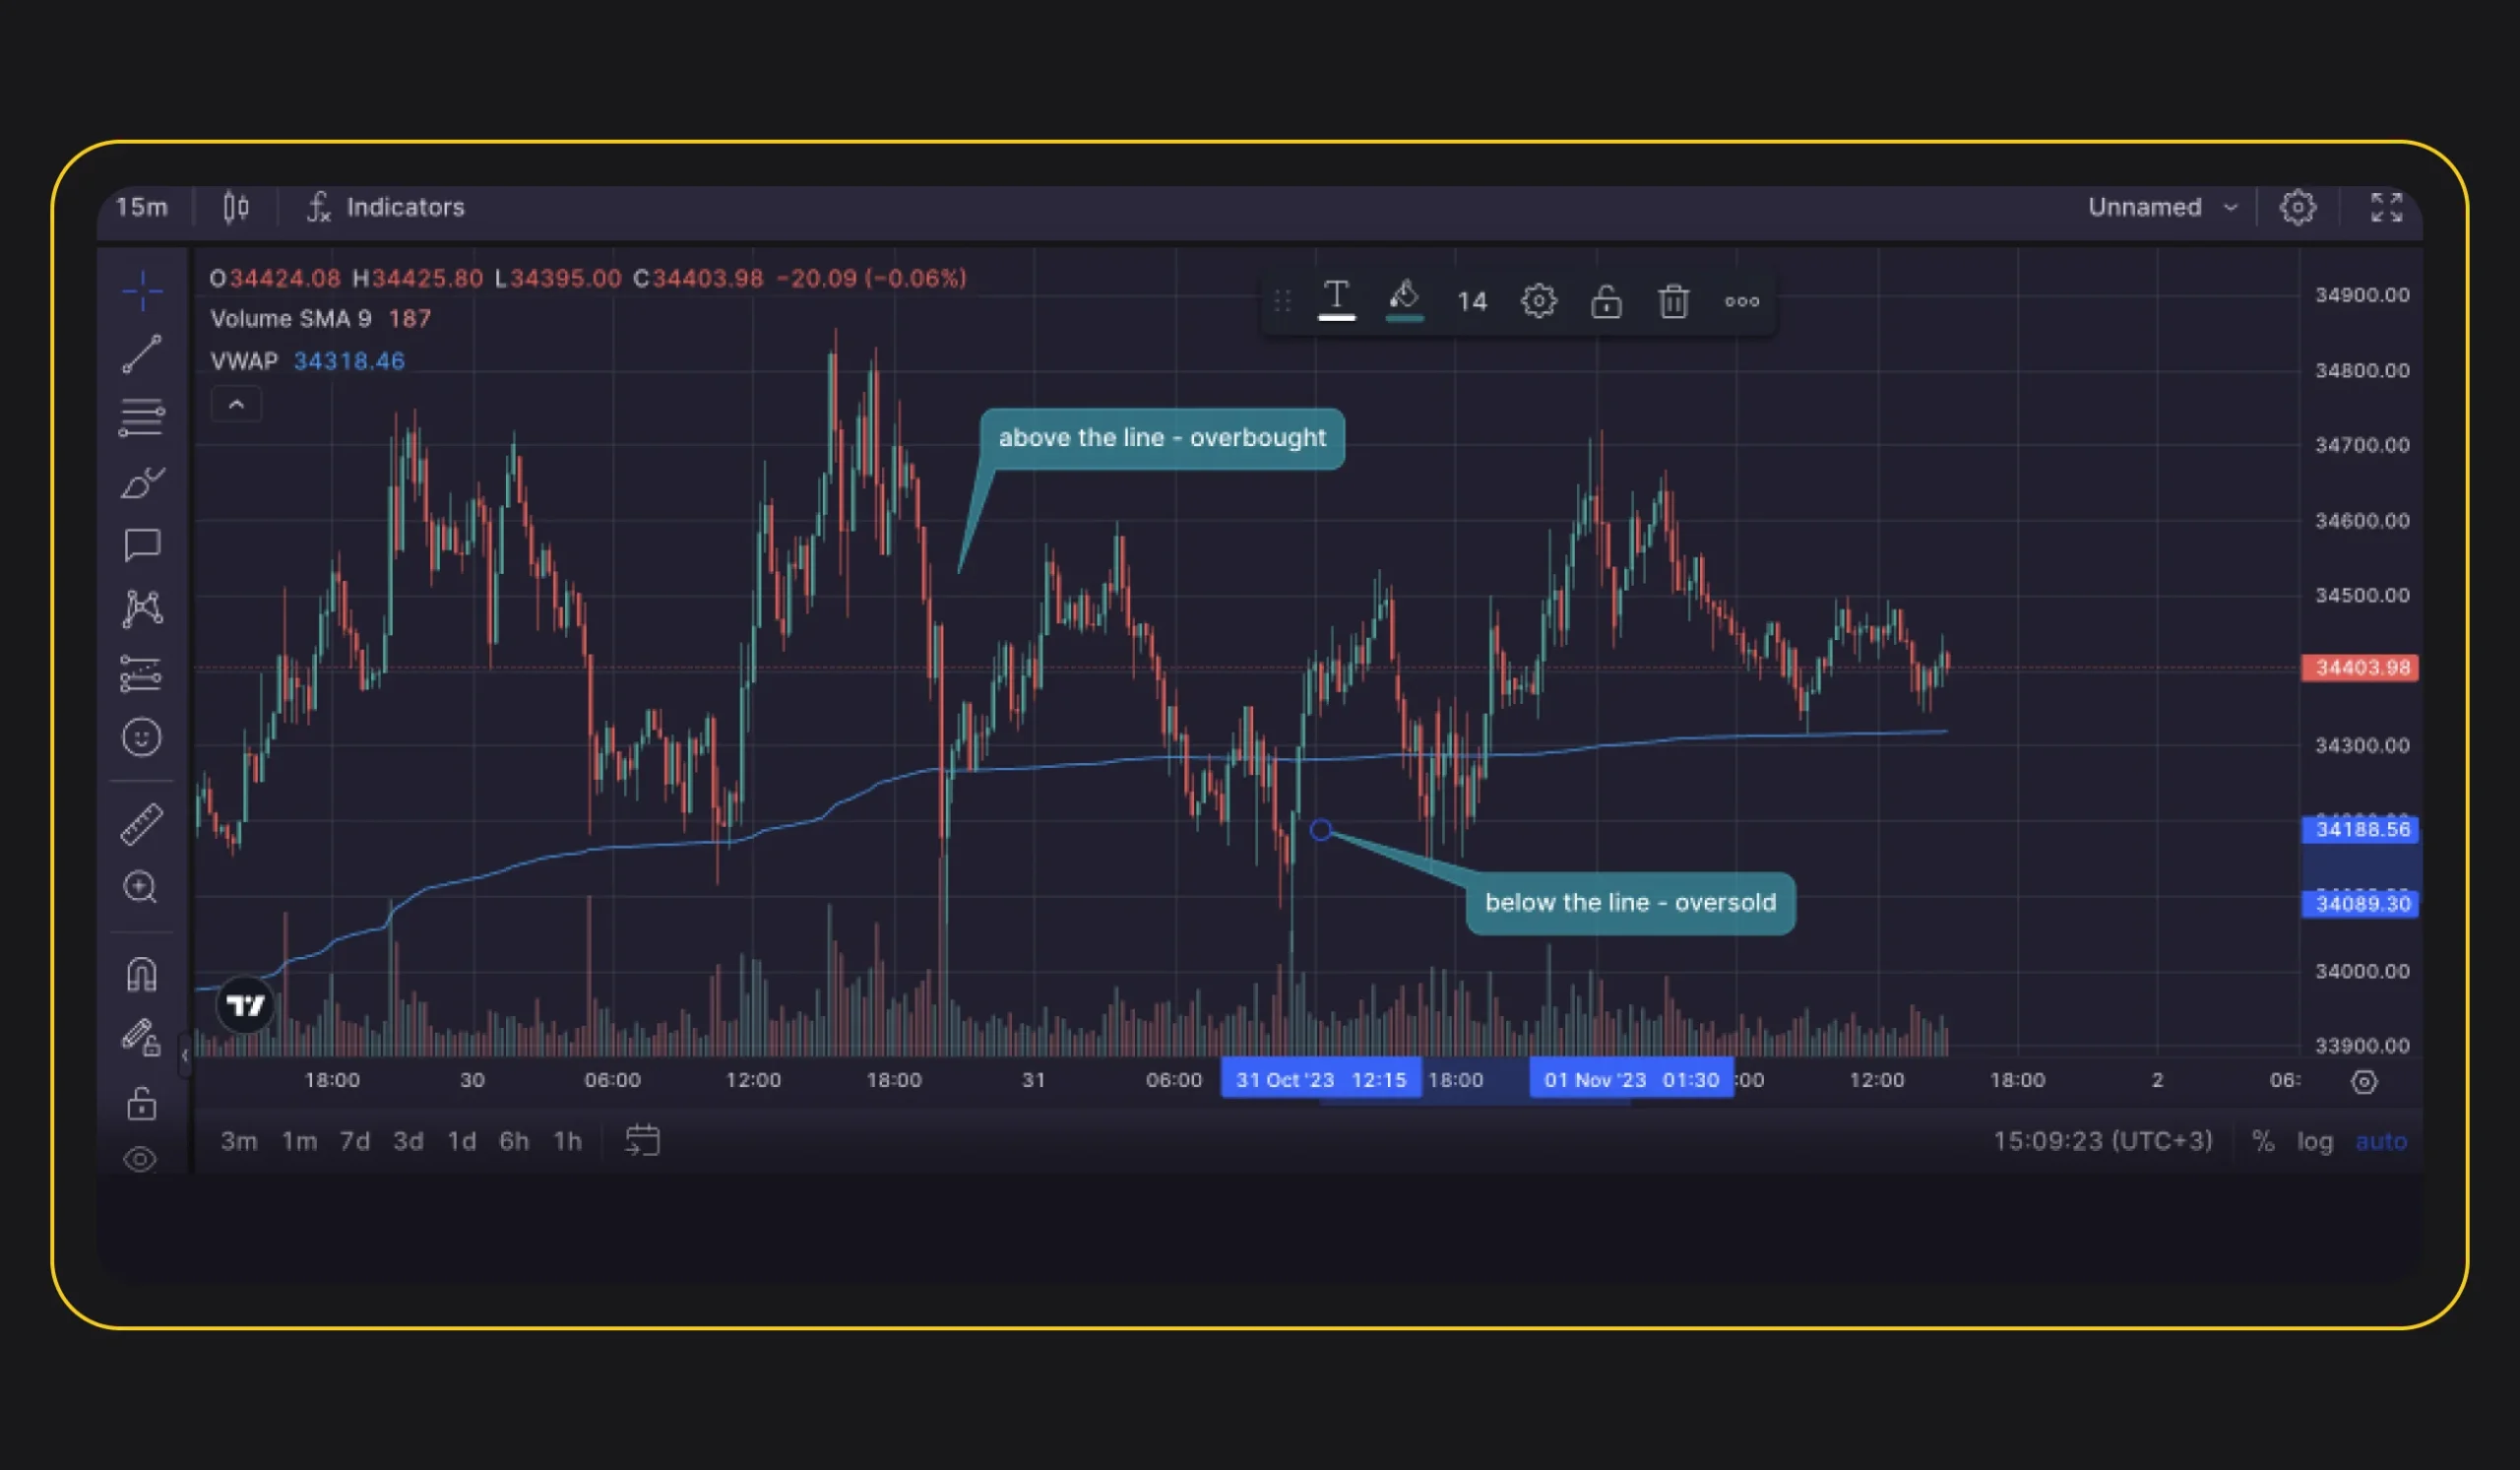
VWAP is computed by multiplying the average asset price over a specified period by the trading volume during that same period. The total volume for the entire trading day leading up to the current period is then divided by this figure.
Institutional traders frequently use VWAP to time their trades to move an asset’s price as little as possible. Therefore, during periods of activity by institutional traders, prices tend to return to the VWAP. If nothing else is going on, you could purchase when the price is lower than the VWAP.
VWAP is also used to determine support and resistance levels throughout the day.
Also Read
8 Important Bearish Candlestick Patterns Every Trader Should Know
2. Moving Averages
VWAP and moving averages are similar, but moving averages don’t take trading volume into account. Instead, they only consider an asset’s average price over a given look-back period.
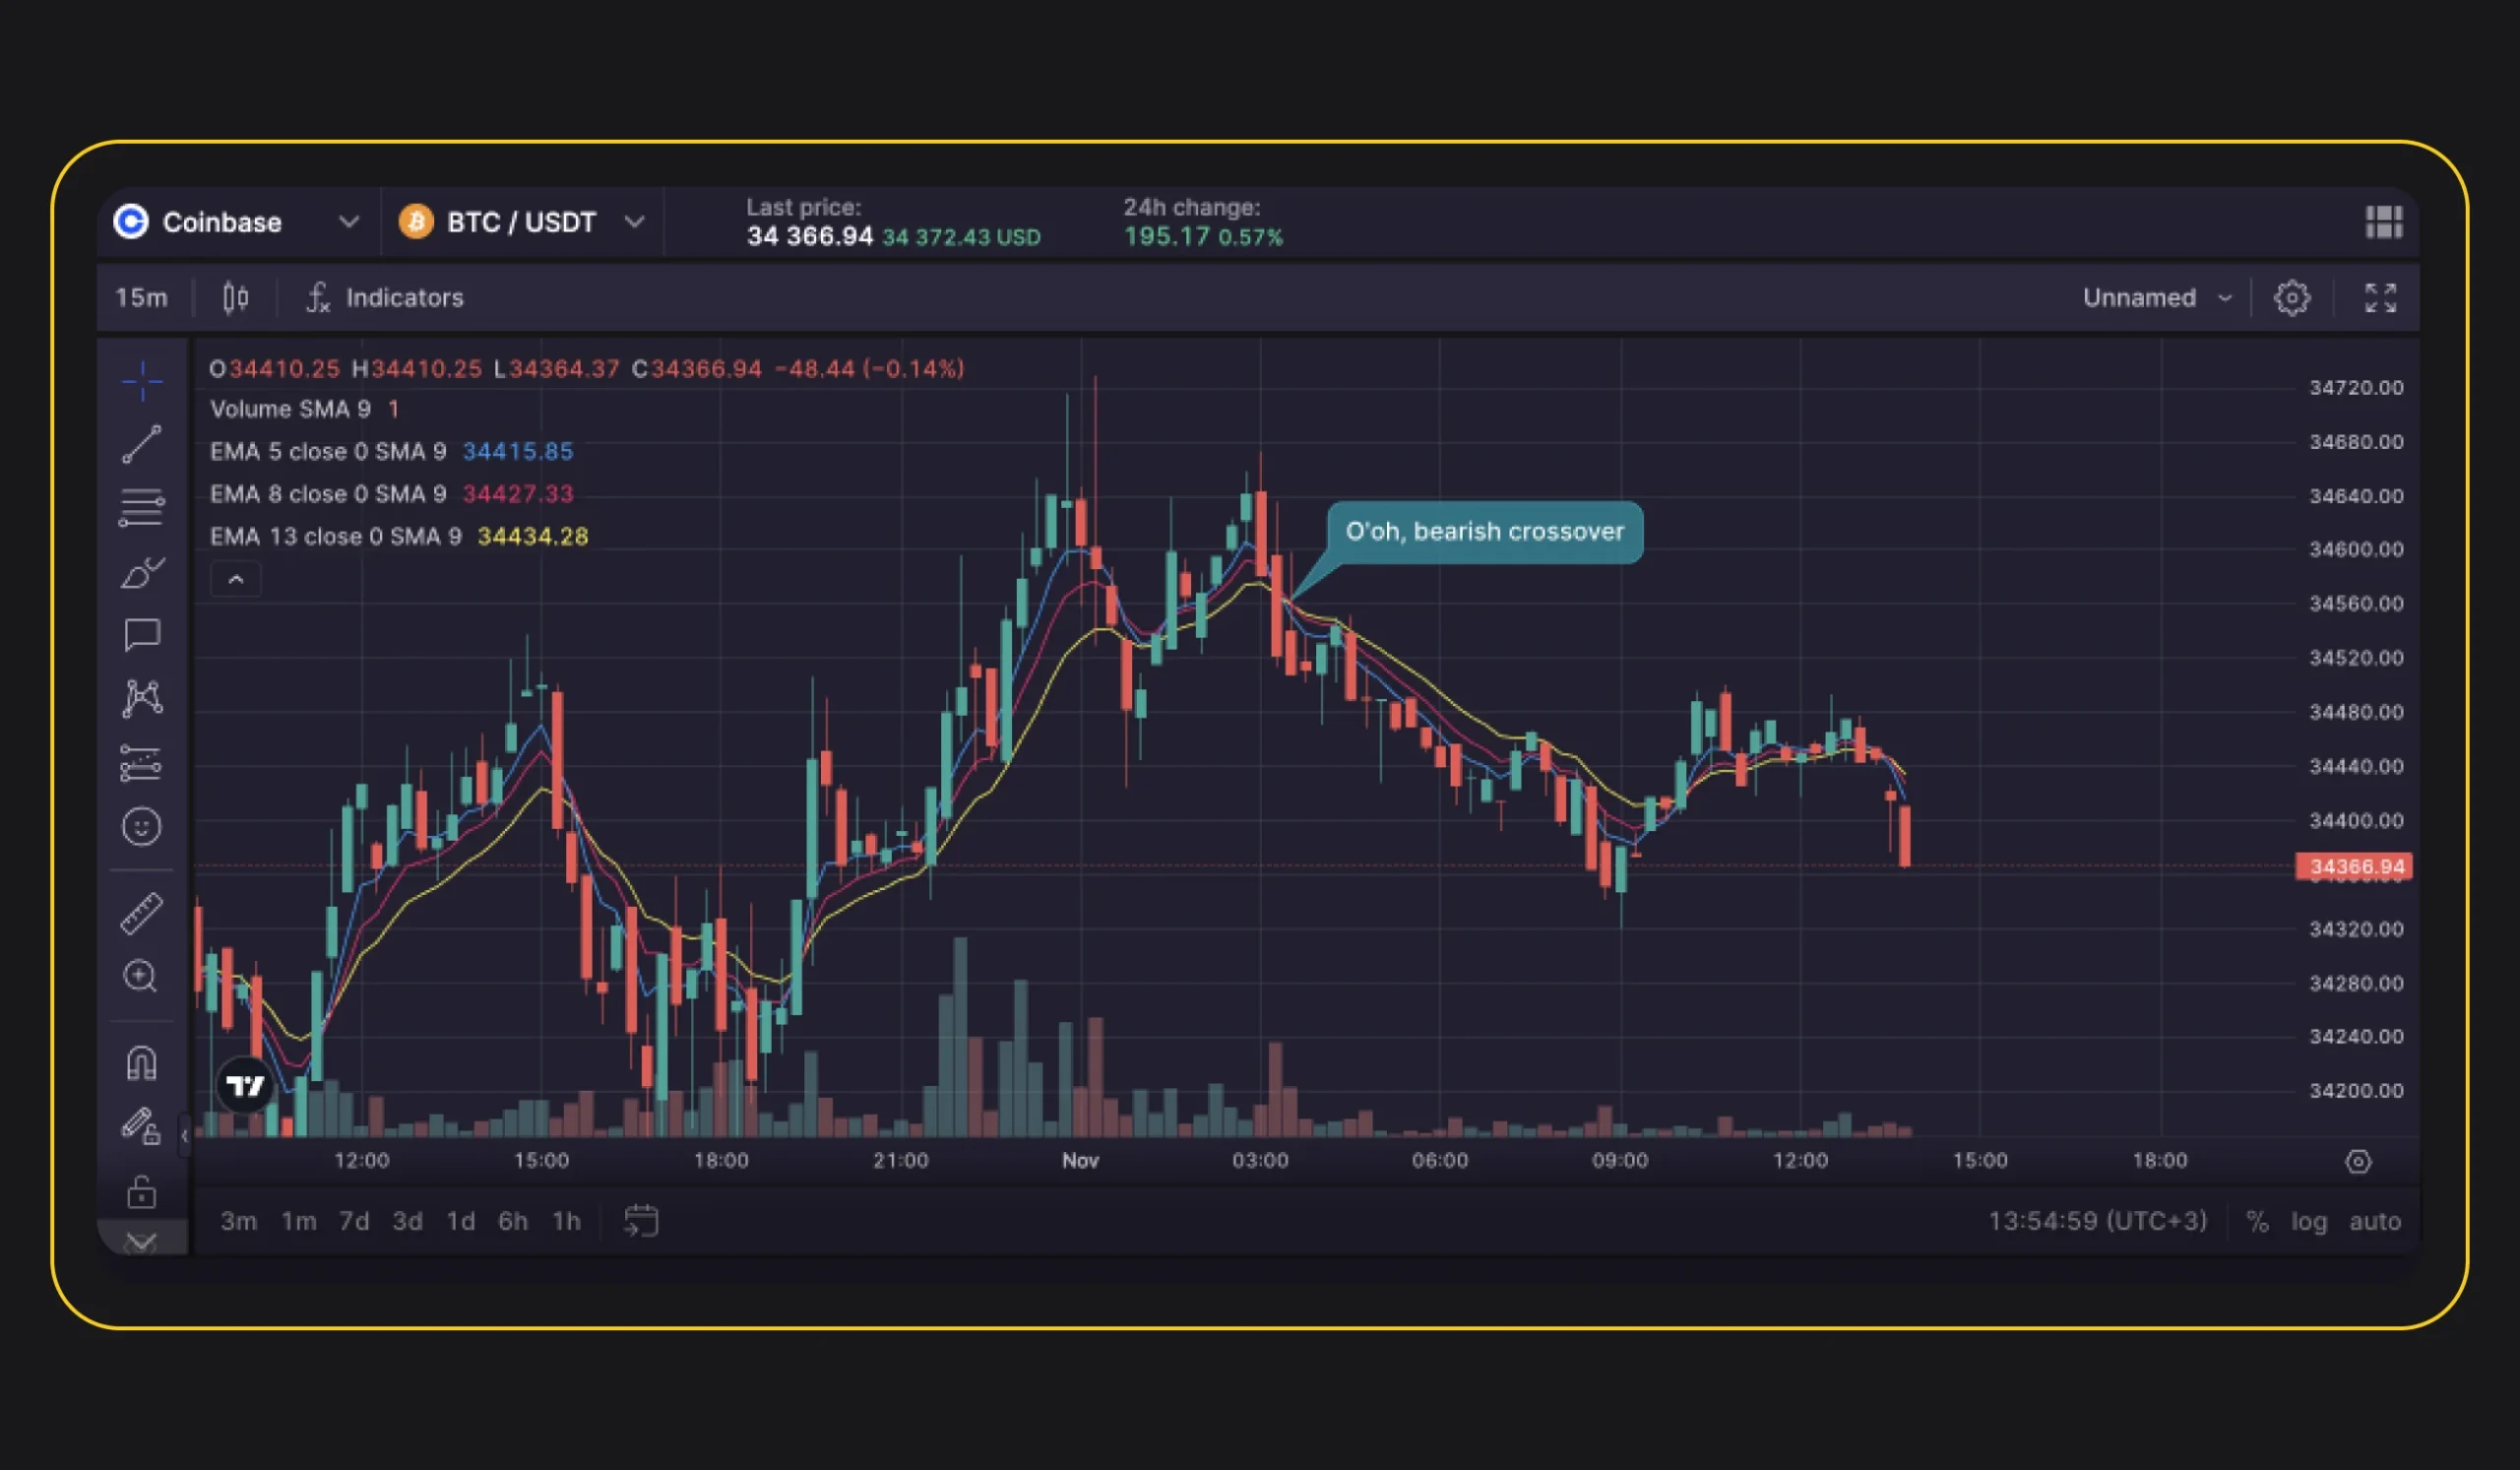
For day traders, look-back periods of 10, 20, 50, and 200 bars (which can be hourly, daily, weekly, or 15-minute bars) are common. While a longer moving average period smoothes out long-term volatility and can help identify support and resistance levels, a shorter moving average period provides information about short-term price action. For additional information on whether the recent price action is bullish or bearish, look for times when the short- and long-term moving averages cross.

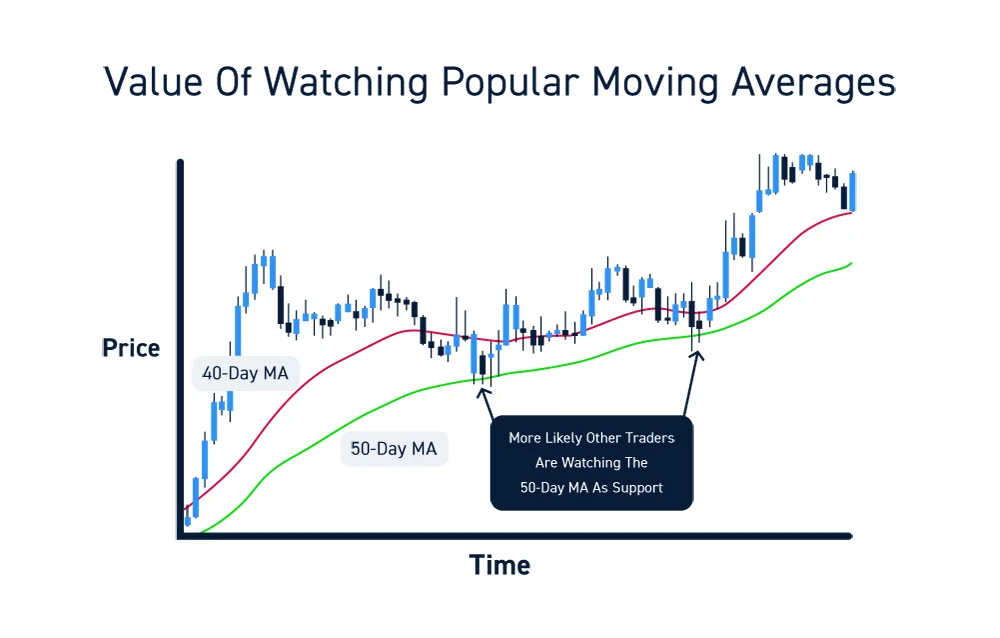
It’s crucial to remember that day traders primarily employ two different kinds of moving averages: the exponential moving average (EMA) and the simple moving average (SMA). The SMA simply calculates the average of all prices over the look-back period, giving the oldest and most recent price points in the computation equal weight. The EMA is more sensitive in erratic market circumstances because it gives greater weight to more recent price points in the computation.
Also Read
8 Bullish Candlestick Patterns: The Ultimate Guide 2024
3. Momentum Oscillators
A group of technical indicators known as momentum oscillators is used to gauge the price momentum of an asset. The relative strength index (RSI) and the stochastic oscillator are two of the most widely used momentum oscillators.
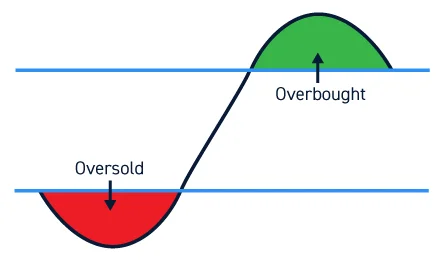
The RSI is simple to understand and ranges from 0 to 100. An asset is deemed overbought if its RSI is higher than 70–80. An RSI of less than 20–30 indicates an oversold situation. But bear in mind that an asset with significant momentum may remain overbought or oversold for an extended time, so RSI alone should not be relied upon as a trading signal.
The stochastic oscillator, which also spans 0 to 100, is made up of two lines: %K, which is a fast-moving oscillator, and %D, which is a moving average of %K that reacts to changes in price action more slowly. In addition to having overbought and oversold levels similar to the RSI, traders can also use the stochastic oscillator to detect changes in momentum direction by keeping an eye out for crossovers between the %K and %D lines.
Open a Free Demat Account on Zerodha and use Sensibull and Streak for Free
4. MACD
Moving average convergence divergence, or MACD, is another momentum indicator that day traders commonly employ. The MACD, or difference between slow-moving and fast-moving averages, is computed by deducting the asset’s 26-period EMA from its 12-period EMA. On top of the MACD, a second line is also plotted; this is known as the signal line. The MACD’s 9-period moving average serves as the signal line.
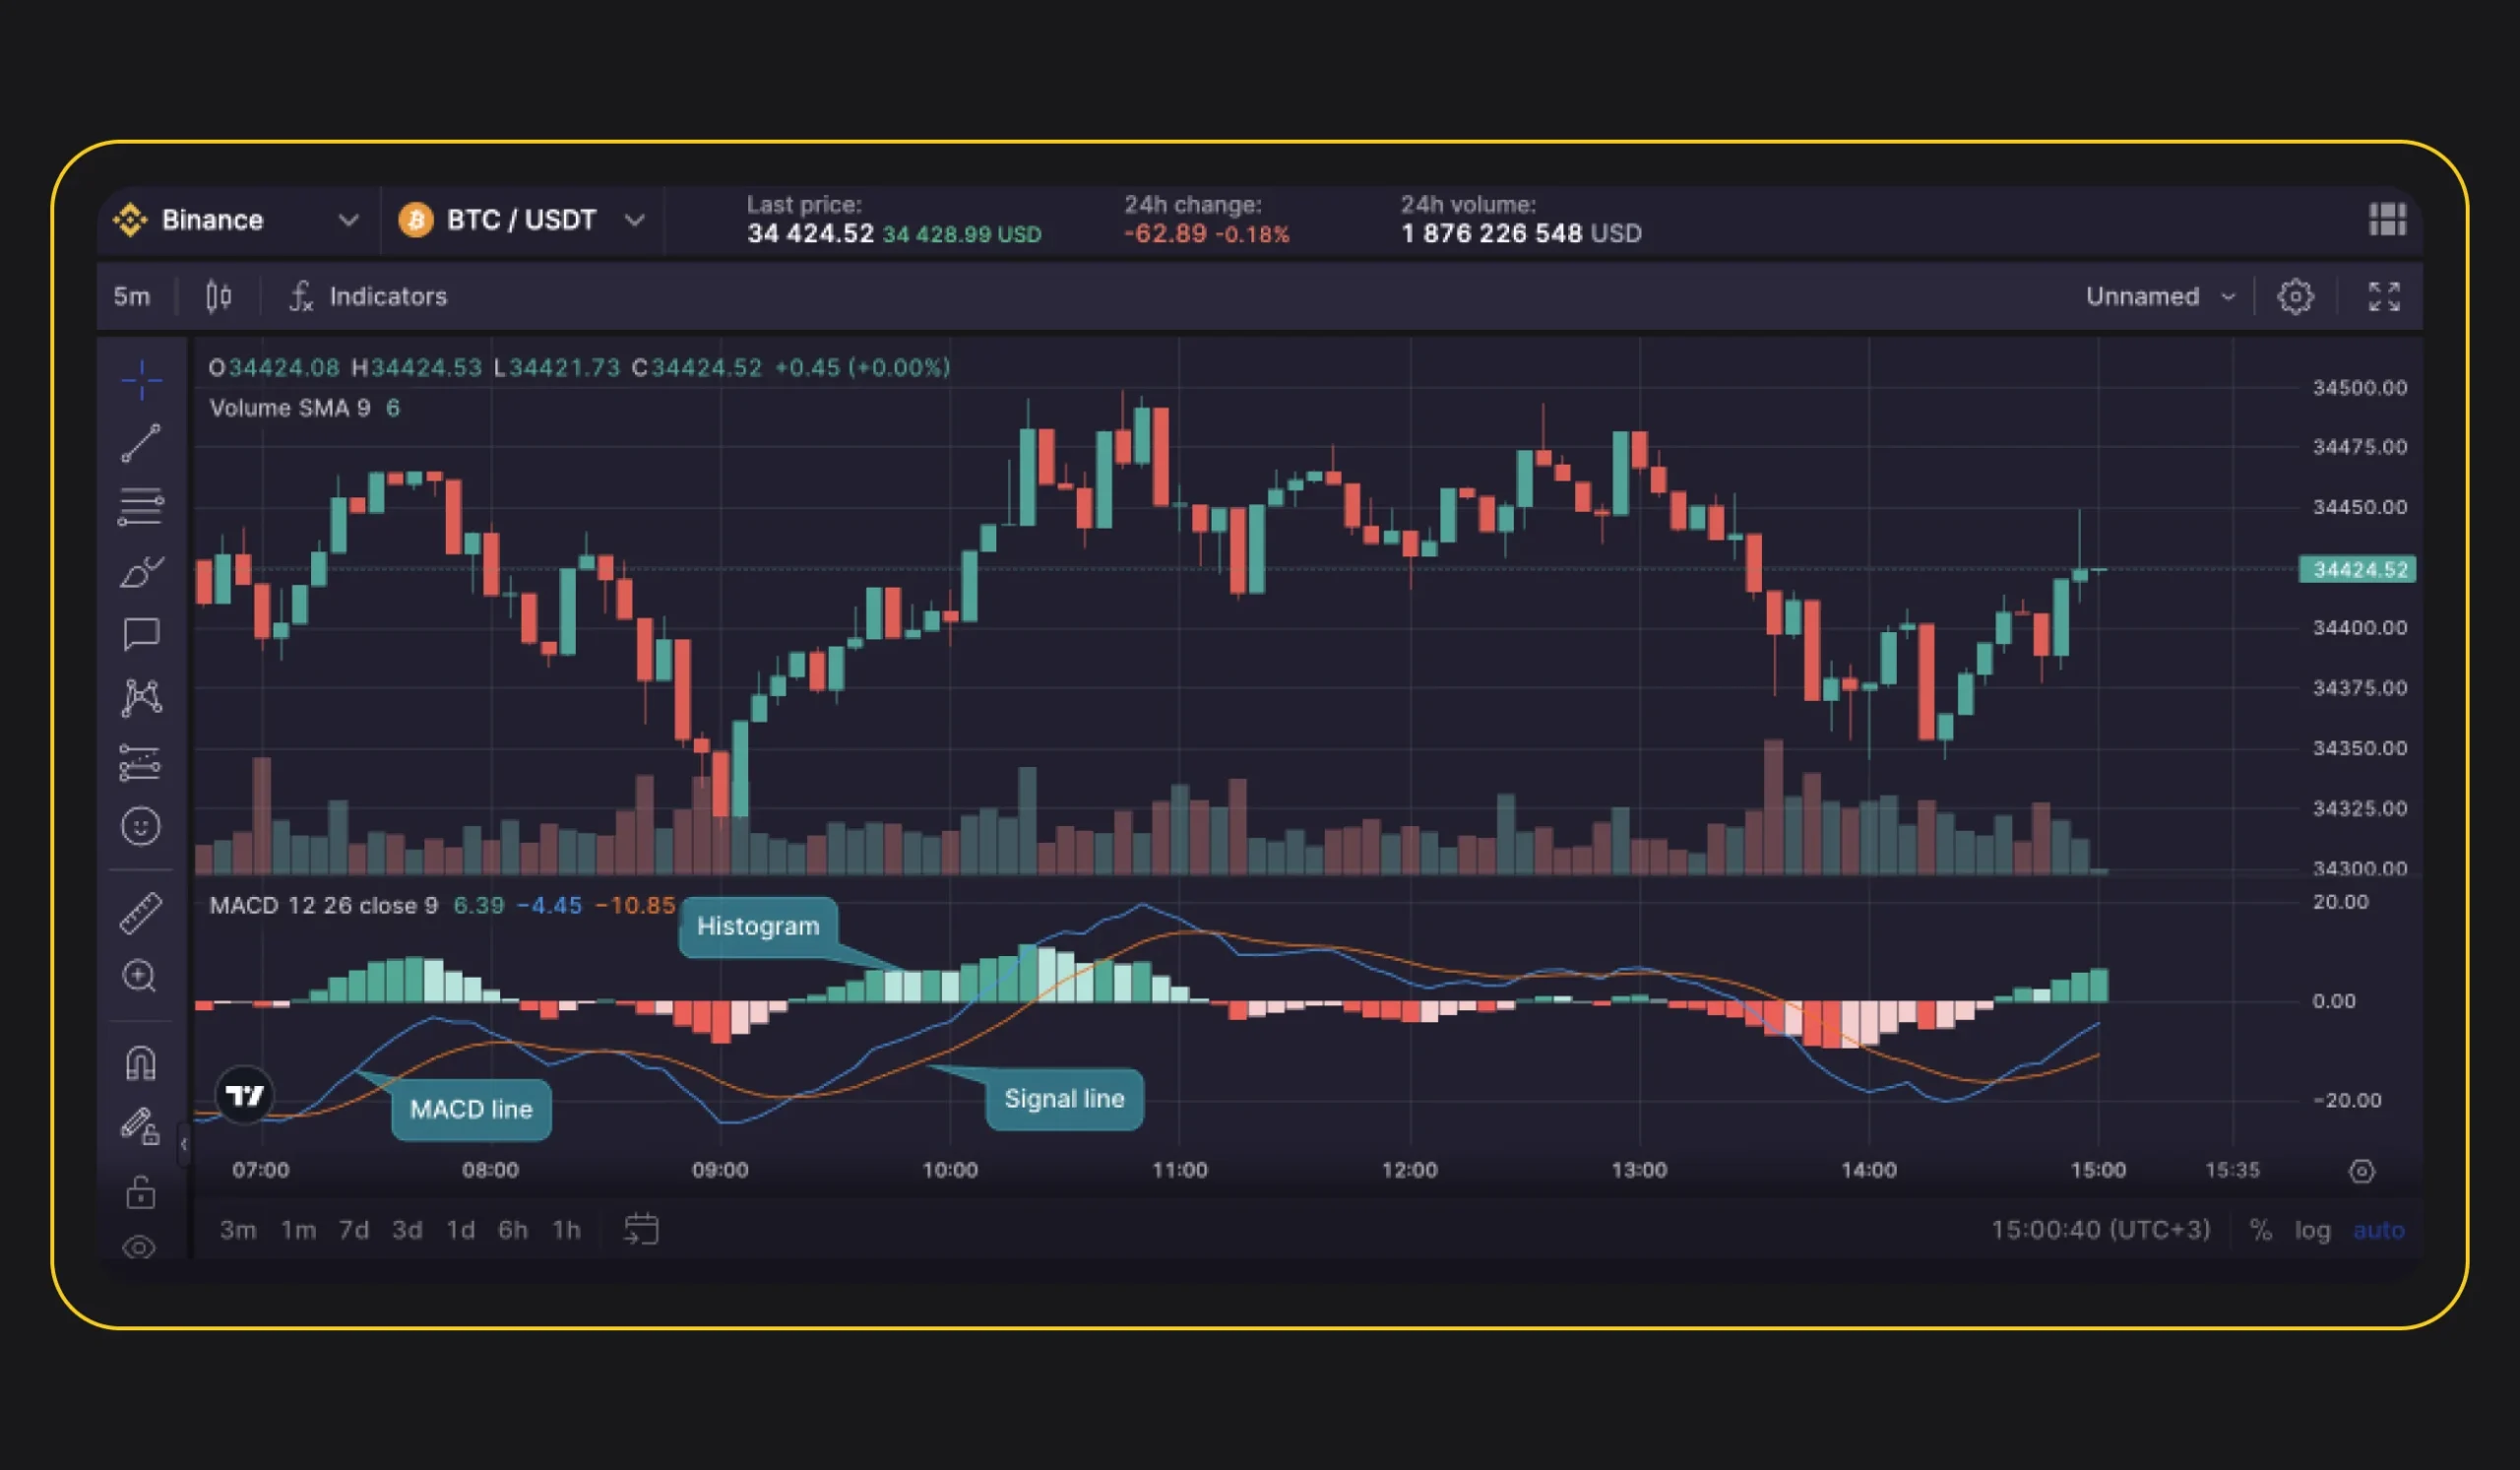
There are various applications and interpretations for the MACD, but the most popular one is to search for instances where the MACD crosses its signal line. A bullish trade signal is produced by an upward cross, or when the MACD line crosses above its signal line from below, and a bearish trade signal is produced by a downward cross.
Also Read
Types of Trading in Stock Market
5. Relative Strength Index (RSI)
Relative Strength Index, or RSI, is regarded as one of the top indicators for day trading. The RSI can be used to determine if a stock is in the overbought or oversold zone for intraday trading. The relative strength index (RSI) fluctuates between 0 and 100. If the RSI is trailing below 30, the stock is thought to be trading in the oversold zone; if it is above 70, the stock is thought to be trading in the overbought zone.
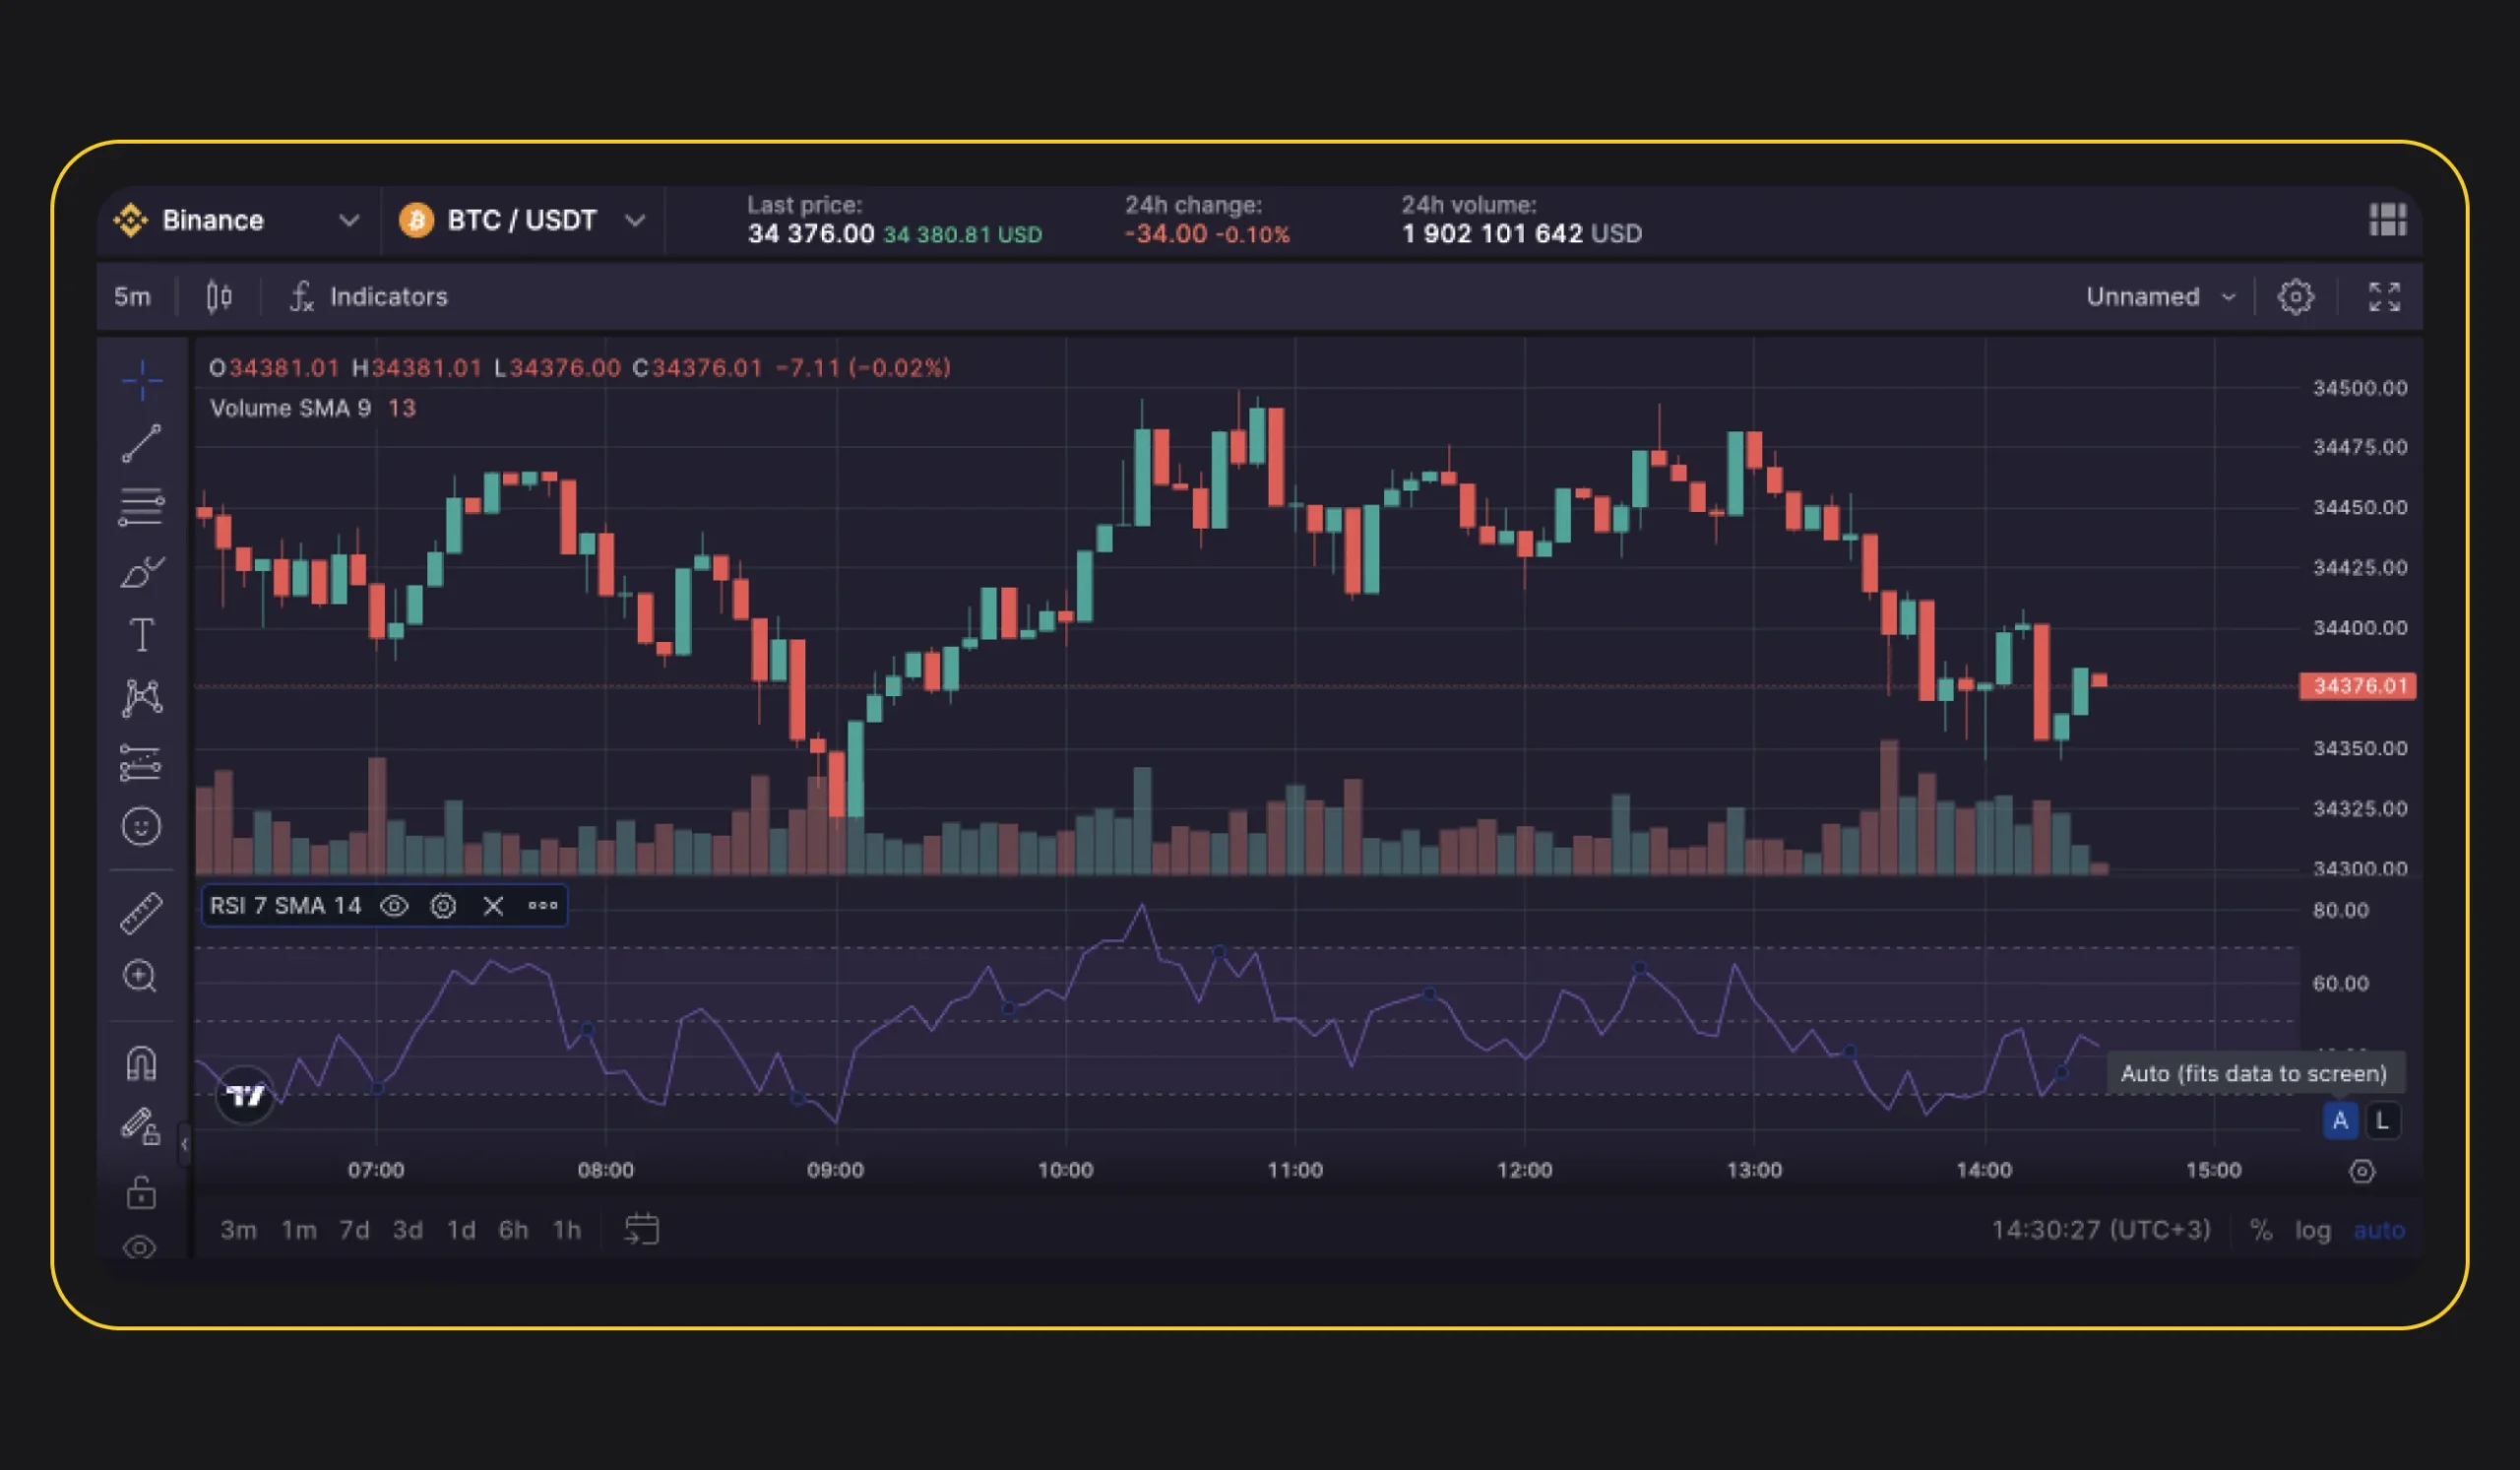
Since the RSI and stock price are directly correlated, a decline in one indicates a decrease in the other. The stock price rises in tandem with an increase in RSI. You can adjust your trading strategies during intraday trading by using the RSI.
6. Bollinger Bands
It is one of the most helpful technical analysis tools for intraday trading since it tracks the movement of the stock price and determines the volatility of the stock using the standard deviation. Support and resistance to the range of stock volatility are displayed by three bands. Additionally, when the Bollinger Bands expand or diverge, it indicates a period of extreme volatility for the stock or market.

Bollinger Bands, on the other hand, indicate low volatility when they shrink or get closer to one another. Nonetheless, the standard deviation—which fluctuates in tandem with changes in volatility—is used to quantify volatility. Choosing the appropriate stocks for intraday trading is one way to take advantage of the dynamic behavior of Bollinger bands.
Also Read
What is Grey Market Premium (GMP) in IPO
7. Stochastic Oscillator
This type of momentum indicator works well for intraday and swing trading. Additionally, understanding the stock’s momentum is crucial to the success of your day trades. When comparing a stock’s closing price to a range of prices over a while, one can use a stochastic oscillator.
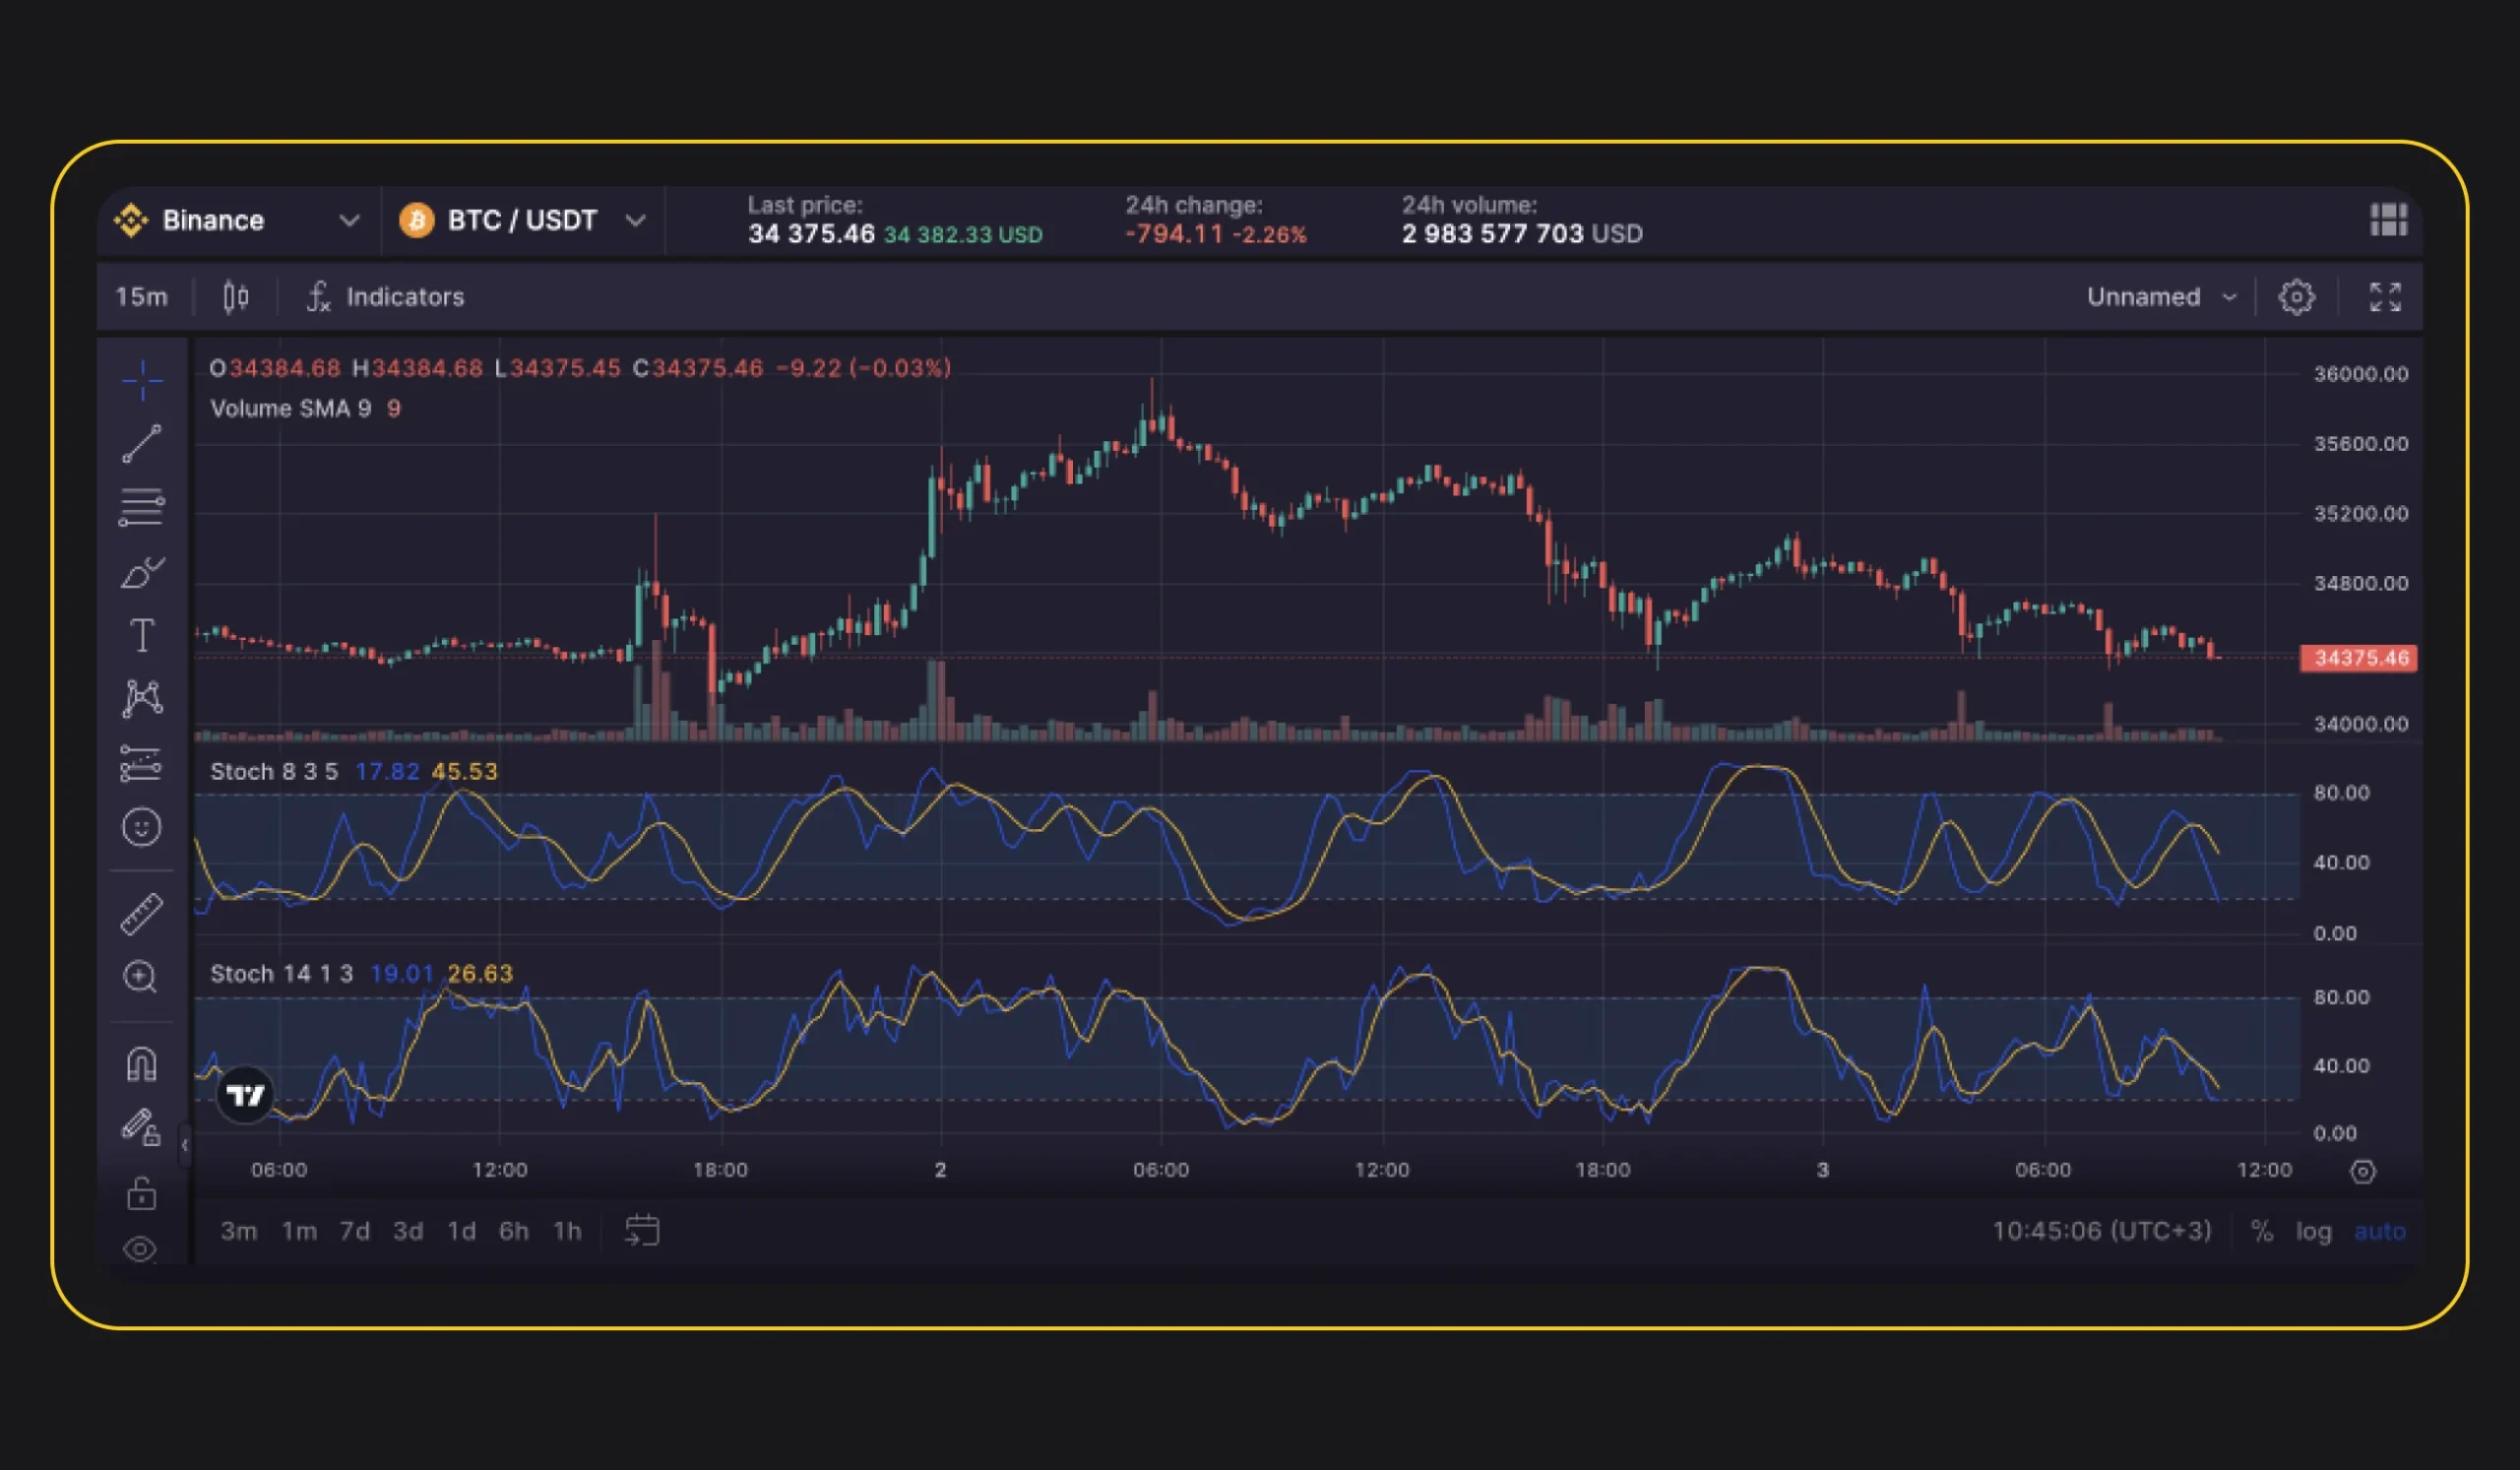
Demand is slowly declining when the stock price moves at a historical high and the oscillator levels do not stay the same as the price. In terms of the intraday market, it also suggests that there could be a stock price decline.
When the trend is upward, the price also reaches a new high, according to the stochastic oscillators, which are plotted between 0 and 100. On the other hand, the stochastic tracks whether the price is heading towards new lows during a downtrend. The stochastic can be used as an indicator of overbought and oversold conditions; levels below 20 are regarded as oversold, and levels above 80 as overbought.
Also Read
8. Commodity Channel Index
Donald Lampert invented the Commodities Channel Index (CCI) in 1980. Because of its accuracy, it is one of the best and most widely used technical indicators in day trading.
It compares the present price level to an average price over a specific period to spot trends or signal extreme conditions.
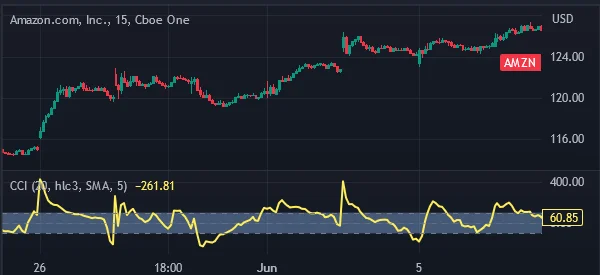
The CCI level is often high when prices are higher than average. Conversely, when prices are lower than their average, CCI is low. As such, it serves as a crucial overbought/oversold indicator.
The majority of CCI levels frequently fall between -100 and +100. When these boundaries are crossed, there is typically a severe circumstance that necessitates extreme caution when making trades. Bulls benefit from a positive CCI value, while bears benefit from a negative CCI.
Open a Free Demat Account on Zerodha and use Sensibull and Streak for Free
9. Average Directional Index (ADX)
One crucial indicator that traders use to spot trends is the Average Directional Index or ADX. The plus directional movement (+) and the minus directional index (-) combine to form the Average Directional Index.
When the current high price less the previous high is greater than the previous low less the current low, the directional movement is positive.
Conversely, when the current high is less the previous high is greater than the previous low subtracted from the current low, and the directional movement is negative. Comprehending these ideas is crucial for any trader.
However, manual calculations are not necessary because the majority of trading systems are automated. A weak trend is indicated by an ADX value less than 30, and a strong trend is indicated by a value above 25.
Consequently, when the pair declines, a trader should buy at the pullback areas if the ADX value is high. The portion that pulls back will serve as the support.
Also Read
Explore 12 Passive Income Ideas In India for 2024
10. Fibonacci Retracement
Originating from the Fibonacci sequence, Fibonacci retracement levels are these cool horizontal lines that suggest potential areas of support and resistance.
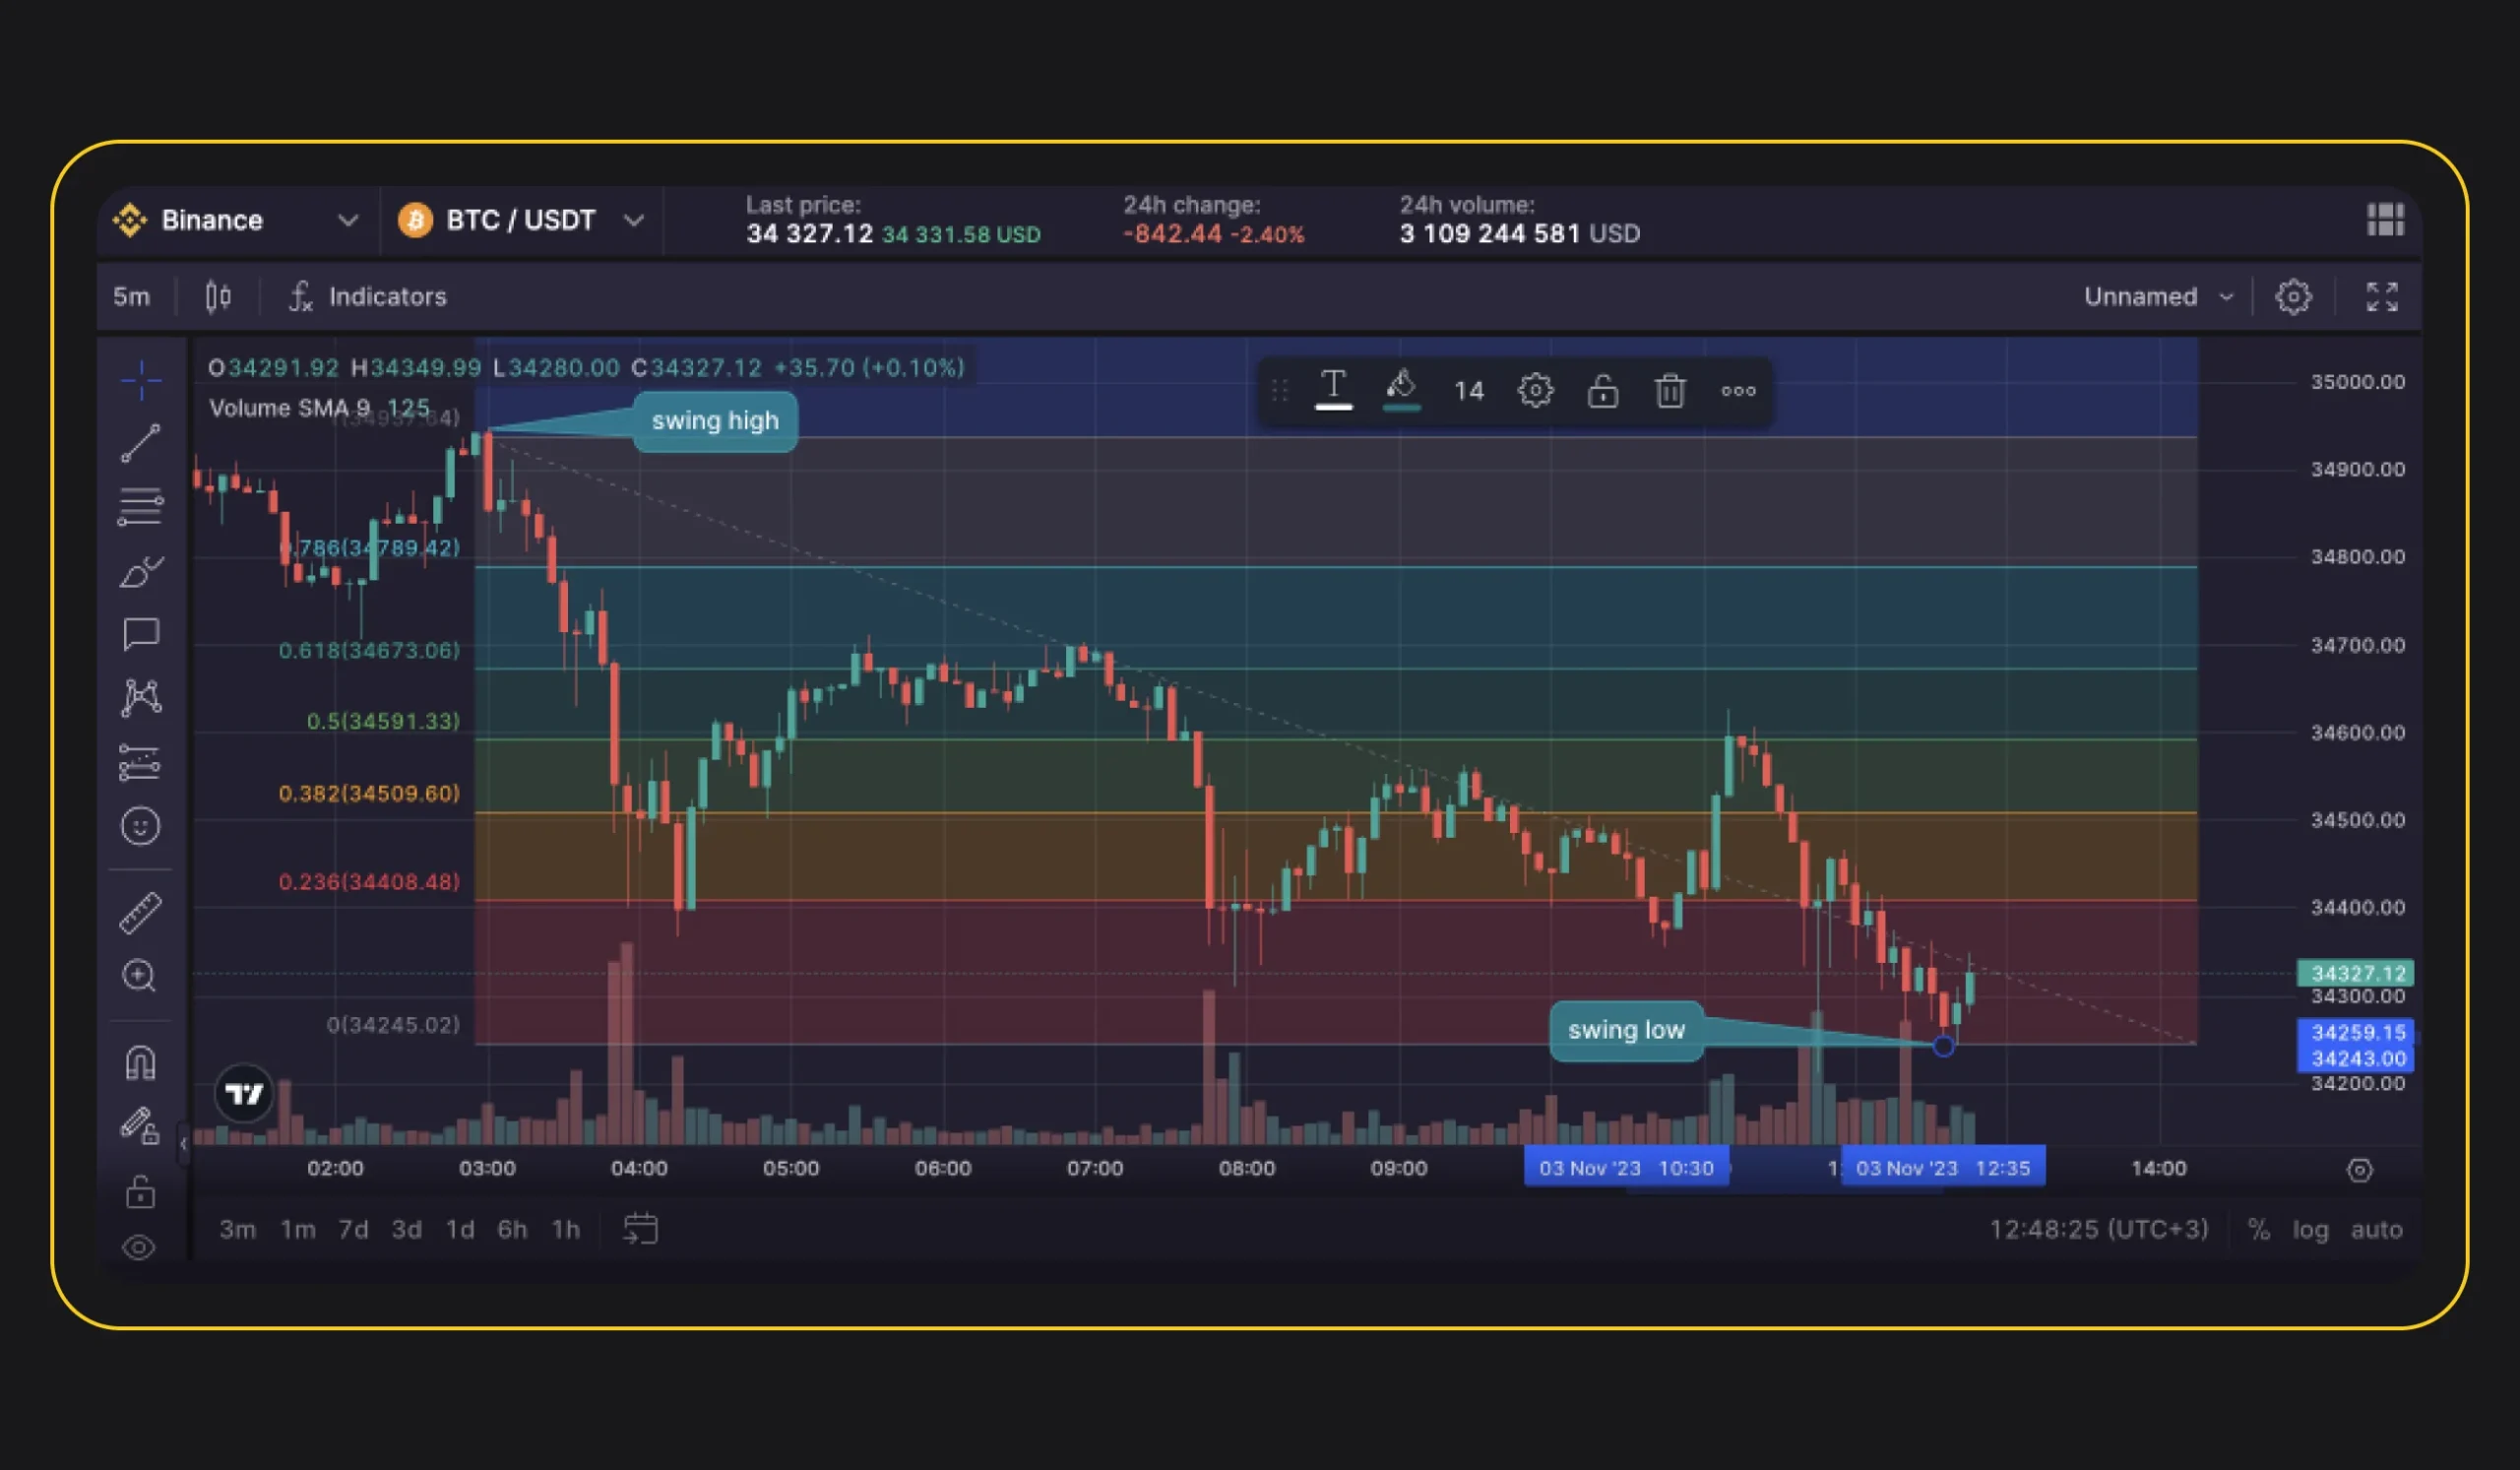
These levels are all tagged with percentages. This percentage indicates the extent to which the price has reversed a previous move. Fibonacci retracement levels are found at 23.6%, 38.2%, 61.8%, and 78.6%. Although the 50% level isn’t formally a Fibonacci ratio, traders frequently use it.
This indicator’s versatility is what makes it so beautiful. The indicator whips up the levels between any two significant price points that you can draw, such as a high and a low.
Fibonacci retracement levels are fixed, in contrast to moving averages. Because of their fixed nature, price levels are easy to recognize, anticipate, and respond to when they are put to the test. These levels serve as inflection points when a reversal or break in the price trend is likely.
Conclusion
To sum up, any trader who wants to assemble a complete set of trading tools must utilize technical indicators. Through the utilization of diverse indicators, including stochastic oscillators, Bollinger Bands, and moving averages, traders can acquire a significant understanding of market patterns and possible points of entry and exit. While it’s crucial to keep in mind that no single indicator can ensure success, traders can improve their chances of making wise decisions by combining multiple indicators and utilizing them in addition to other types of analysis.
Open a Free Demat Account on Zerodha and use Sensibull and Streak for Free


