Single candlestick patterns are useful for predicting the future, analyzing historical data, and gauging market trends. They are technical indicators in their most powerful form. Since candlesticks are formed based on past market action, they can be considered historical indicators. However, the candlesticks that formed are very helpful in predicting future trends and price patterns.
Table of Contents
What Are Single Candlestick Patterns?
A single candle creates a single candlestick pattern. In this case, the trading signal is produced based on a single day’s trading activity rather than on a series of candles. The 1-day candlestick chart is typically used by traders to pinpoint a single candlestick pattern. It takes very little time and is one of the simplest types of technical analysis.

Understanding Single Candlestick Patterns
- Trend reversal patterns are categorized as single candlestick patterns. It is impossible to categorize a single candlestick pattern as a continuation pattern. Nonetheless, individual candlestick patterns frequently require confirmation and should be interpreted in light of the candlesticks that came before them.
- A trend must be established before a trend reversal pattern can emerge. In non-trending markets, they ought to be disregarded.
- While trading, one must be aware of the candle’s length. The length represents the day’s range. The intensity of the buying and selling activity increases with the length of the candle. It is possible to conclude that there was little trading activity if the candles were short. The length of the candles must also be taken into consideration when qualifying trades. It is not advisable to trade based on short, muted candles.
People Also Read:
Types of Trading in the Stock Market
8 Bullish Candlestick Patterns: The Ultimate Guide 2023
8 Important Bearish Candlestick Patterns Every Trader Should Know
Japanese Candlestick Patterns
- Technical analysis uses a Japanese candlestick to determine the state of the market right now and forecast future movements. The first known inventor of it was a Japanese rice trader named Munehisa Homma in the early 1700s. It was first made public by Steve Nison in his 1991 book Japanese Candlestick Charting Techniques.
- It presents the market price graphically and gives a detailed and precise representation of it. Traders can quickly discern market trends by observing the length and color of the candlesticks. Japanese Candlestick Pattern Types.
Hammer And Hanging Man
Rules of Recognition for a Hammer

- The Hammer Pattern happens when a candle opens at a high point but is unable to hold there, falling sharply. However, with persistent buying interest, the candle can rise again, closing in the green and not far from the opening price. Here, the wick’s length must be at least twice as long as the body.
- After a downward trend, the Hammer pattern—a single candle bullish reversal pattern—can be identified. There is a long wick that extends lower and is twice as big as the short body, and the opening price, close, and top are roughly at the same price.
Requirements for a Hanging Man

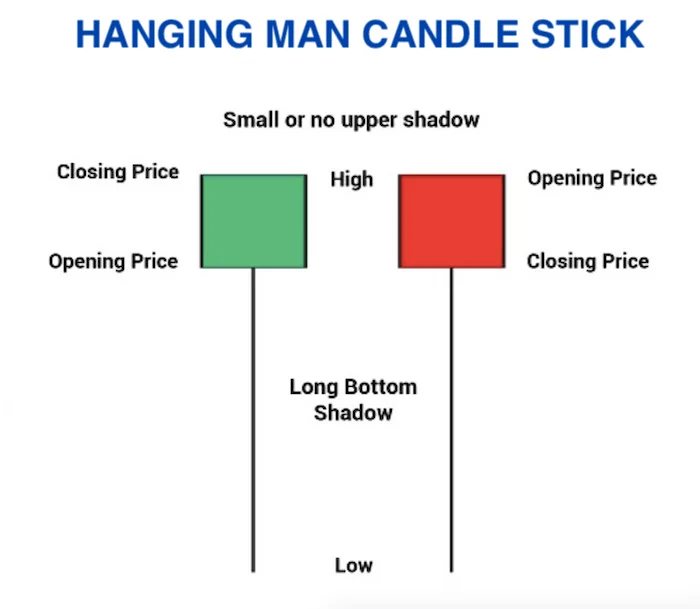
- When prices are rising, a hanging man candlestick pattern appears, signaling that a price decline may be imminent. A small real body, a long lower shadow, and little to no upper shadow make up the candle. The hanging man indicates that interest in selling is beginning to rise. Following a price advance, this bearish reversal candlestick pattern appears. A few price bars moving higher overall should make up at least part of the advance, no matter how big or small.
- The pattern of the hanging man is merely an alert. The hanging man pattern is not a legitimate reversal pattern unless the price moves lower on the following candle. We refer to this as confirmation. Usually, traders will exit a long or short position during or after the confirmation candle, not earlier.
Open a Free Demat Account on Zerodha and use Sensibull and Streak for Free
Inverted Hammer And Shooting Star
Inverted Hammer

- The Hammer Candlestick Pattern inverted is a pattern of bottom reversal. This pattern usually appears as a downtrend that is about to reverse. The inverted Hammer Candlestick formation can serve as a warning indicator of a possible bullish reversal pattern because it typically appears at the bottom of downtrends.
- Traders can predict whether prices will rise or fall based on what happens the day after the Inverted Hammer pattern is formed. The formation of an inverted Hammer after a protracted downtrend is bullish because prices resisted moving lower during the day. Prices were driven back to the opening level by sellers, but rising prices indicate that bulls are challenging the bears’ strength.
Shooting Star

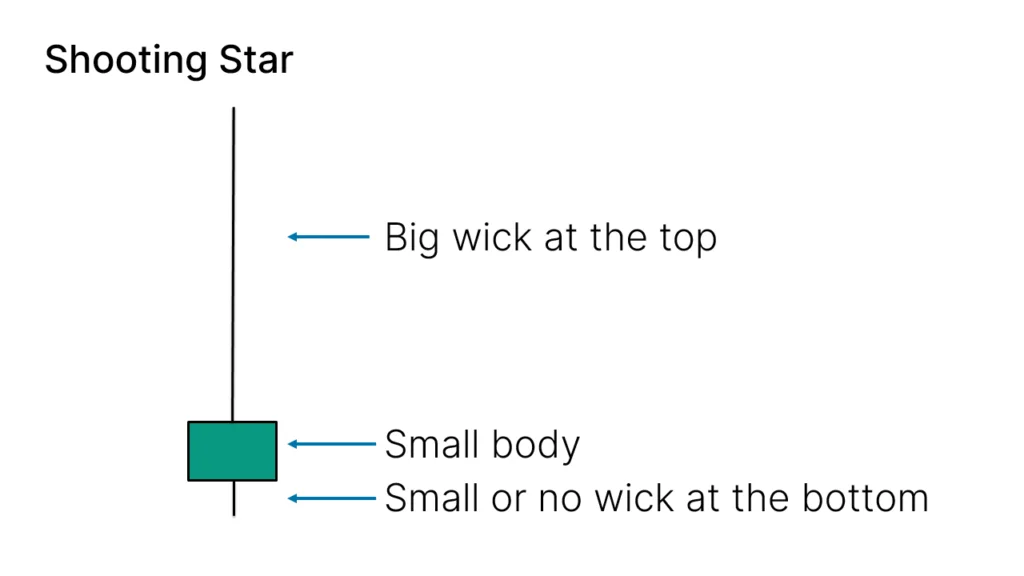
- A shooting star is seen as a particular kind of reversal pattern in technical analysis. The shooting star has an identical appearance to an inverted hammer, but it is found during an uptrend rather than a downtrend. It is composed of a long upper wick that is at least twice as large as the lower wick and a small lower body candle with little to no lower wick.
- In reality, shooting stars are hammer candles that have been turned upside down to resemble the inverted hammer pattern. The shooting star happens at the apex of an uptrend, which makes a difference. The bearish chart pattern is indicative of an impending downtrend. Conversely, the inverted hammer is a bullish chart pattern that indicates that the price is likely to trend upward and can be found at the bottom of a downtrend.
List of all the Single Candlestick Patterns
1. Marubozu Candlestick Pattern
Marubozu means “the bald” in Japanese. As a result, a marubozu candle has no upper or lower shadow and only its main body. There are two varieties of marubozu candlestick chart patterns as well: the bearish and the bullish marubozu.

Let’s examine the three primary guidelines that apply to candlestick patterns as we continue. These are as follows:
- Buying strength and selling weakness.
- Being flexible with patterns.
- Searching for a previous trend.
However, marubozu is a type of candle that defies the final rule of candlestick patterns; as such, it can occur anywhere in the middle of a candlestick chart and is independent of the previous trend.
2. Spinning Top Candlestick Pattern

Similar to its name, it has a small real body and nearly equal upper and lower shadows, giving the appearance of a spinning top. Although it might not provide a precise entry or exit point for a trade, it does offer helpful information about the state of the market at the moment.
3. Doji Candlestick Pattern

- The main distinction between a doji and a spinning top is that the former lacks a physical body. We can say that the open and close prices of the stock are nearly equal because it lacks a physical body. A doji aids in trading decisions by offering important stock information.
- Because there is little difference between the stock’s open and close prices, a candle with an extremely thin body can also be categorized as a doji. The candle’s color has little bearing on a doji because it is characterized by a difference between the open and closed prices.
- The fact that the open and close prices are nearly equal is what matters most. On a candlestick chart of a stock, the presence of contiguous dojis indicates a state of indecision in the market, with potential swings in either direction.
Open a Free Demat Account on Zerodha and use Sensibull and Streak for Free
Conclusion
Therefore, a single candle produces a single candlestick pattern. The 1-day candlestick chart is typically used by traders to pinpoint a single candlestick pattern. Japanese Candlestick Formations are Single Candlestick Patterns. They are available in three primary varieties, each with a bullish and a bearish version, and are traded separately.
People Also Read:
Types of Trading in the Stock Market
8 Bullish Candlestick Patterns: The Ultimate Guide 2023
8 Important Bearish Candlestick Patterns Every Trader Should Know
What are Single Candlestick Patterns?
As the name implies, only one candle forms a single candlestick pattern. As a result, the trading signal is produced using data from a single day’s worth of trading activity. If the pattern is correctly recognized and traded, trading based solely on a candlestick pattern can be very profitable.
How do you read a single candlestick?
There are four data points on a candle:
Open: The initial trade made within the time frame that the candle indicates.
High: the price at which it was traded.
Low: the price at which it is traded.
Close: The final trade made within the window of time that the candle indicates.How many single candlestick patterns are there?
There are 42 identified patterns, which are further classified as simple and complex patterns. Author Thomas Bulkowski examines 103 candlestick formations in detail, covering everything from identification rules to statistical analysis of their behavior to specific trading strategies.


1 thought on “Single CandleStick Patterns & Their Type: Ultimate Guide 2025”