Price action patterns known as candlestick patterns can be used to predict future price movement. Their ability to be quickly learned and incorporated into a variety of trading strategies is what makes them special. These patterns come in both bearish and bullish varieties, but in this piece, we’ll focus on the bullish candlestick patterns that are useful in stock trading. Now let’s get started.
Table of Contents
What is a Candlestick Pattern?
A candlestick presentation that depicts the exchange between buyers and sellers in the stock market is called a pattern. You can determine the most likely direction of the stock price by observing the characteristics of the candlestick, such as its body and wicks. Consequently, bearish candlestick patterns indicate that the stock is probably going to enter a downtrend, while bullish candlestick patterns serve as a confluence for long positions.

Bullish Candlestick Patterns
Candlestick patterns with bullish reversals suggest that the current downward trend is about to come to an end and possibly turn upward. There can be one or more candlestick patterns that make up the bullish candlestick pattern.
Before continuing, it is important to remember that: Bullish candlestick patterns should only appear at the conclusion of a downward trend; otherwise, they will behave similarly to continuation patterns. Bullish reversal patterns provide reversal signals; however, one should verify them with additional indicators, such as high trading volume.
Things You Should Understand Before Trading in Candlestick Patterns
Also Read: Types of Trading in the Stock Market
Patterns Are NOT Guaranteed to Work
Candlestick patterns, like the majority of technical analysis tools, indicate the most likely direction of a stock’s price, but they don’t always indicate it. You might be able to boost your trading performance and win rate if you apply them properly. However, since every trading session in the stock market is different, it is challenging to reliably forecast stock prices using only candlestick patterns.
Context Matters
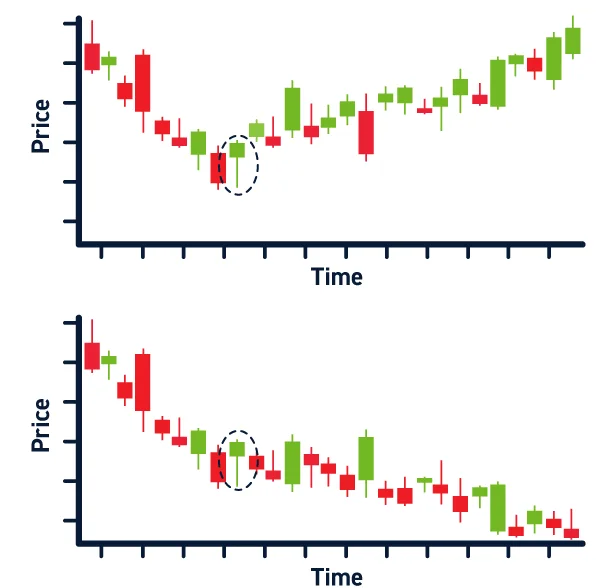
When applying candlestick patterns, remember to take the market environment into account. For market reversals and continuations, various patterns are employed. For instance, it is best to trade bullish continuation patterns when trading a stock that is in a strong uptrend if you have reasons to think the uptrend will continue. You can increase your chances of success by trading these patterns in tandem with the major stock market participants.
Volume increases conviction
Volume can typically be seen by looking at the volume bars next to or below your price chart, depending on the platform you’re on. When it comes to candlestick patterns, traders tend to believe that those with high volume will be more successful than those with low volume. This is due to the common belief among traders that the volume of candles burned indicates the volume of trading activity that takes place within a specific time frame.

Open a Free Demat Account on Zerodha and use Sensibull and Streak for Free
Bullish Candlestick Patterns: The Ultimate Guide
Here are eight bullish candlestick patterns to look out for.

Bullish Engulfing Pattern
A bullish reversal, indicating an increase in buying pressure, is indicated by the bullish engulfing candlestick pattern. As more buyers enter the market and drive prices higher following a protracted decline, this bullish candlestick pattern suggests a reversal from the downtrend.
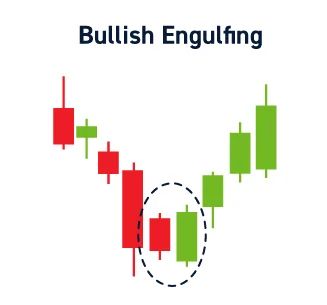
The design consists of two candles, the first red candle’s body entirely engulfed by the second green candle.
When trading with a bullish engulfing pattern, it’s important to keep in mind that the previous trend should have been downward. In addition to providing an exit signal, engulfing candles aid traders in identifying trend reversals that point to the continuation of the trend:
The continuation of an ongoing trend is supported by engulfing patterns. For instance, the identification of a bullish engulfing pattern in an uptrend suggests that the ongoing trend will continue.
Hammer & Inverted Hammer Pattern
Despite their apparent opposites, the hammer and inverted hammer candlestick patterns indicate a bullish reversal.
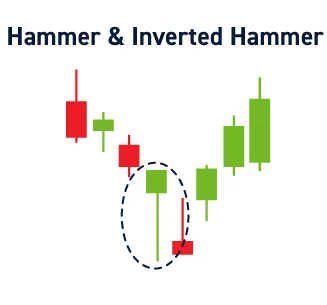
As its name implies, the hammer has a hammer-like shape. This candle is composed of the candle body at the top and a long, thin wick at the bottom. Stated differently, the candlestick features a small upper body and a long wick.
Similar to an inverted version of the hammer is the inverted hammer. It’s a candlestick with a small lower body and a long upper wick.
The kind of candle body doesn’t matter when trading the hammer or inverted hammer. This implies that the hammer could still be valid even if it closed like a long wick with a tiny bearish body.
The extended wick indicates a critical level rejection. In the world of stock trading, rejection is essentially sellers’ incapacity to drive prices down. As a result, buyers enter the market and drive prices up, which causes rejection and the formation of a long wick.
You may be asking why, given its lengthy upper wick, the inverted hammer pattern is bullish. The reason it’s regarded as a bullish candlestick patterns is that the small lower body indicates that selling pressure is lessening as more buyers enter the market.
Piercing Pattern
When a downtrend is coming to an end, a candlestick pattern known as a piercing pattern forms close to the support levels and may indicate bullish reversal signals.
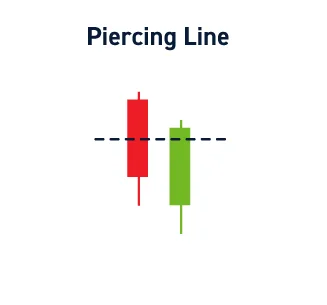
The bearish candlestick in the first pattern and the bullish candlestick in the second form this pattern.
The second bullish candlestick should close above the middle of the first candlestick’s real body and be below the low of the previous candlestick. The bearish candlestick should have a large real body. When trading with this bullish candlestick pattern—the piercing pattern—investors need to consider a few factors:
First of all, because the piercing pattern is a bullish reversal pattern, the trend should be downward. Second, the force at which the reversal occurs is significantly influenced by the length of the candlestick.
The strength of the trend reversal is indicated by the difference in size between the bullish and bearish candlesticks. Fourth, the bullish candlestick ought to close closer than the bearish candlestick’s midpoint.
Finally, the bodies of both the bullish and bearish candlesticks should be larger.
Morning Star Pattern
A bullish reversal is indicated by the triple bullish candlestick patterns known as the Morning Star. It serves as a warning indicator that the downtrend is about to reverse and become an uptrend because it forms at the end of a downtrend.
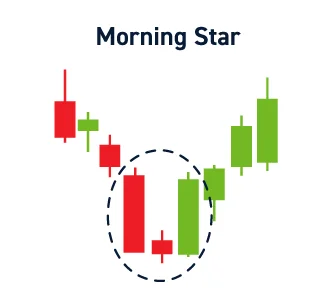
It is composed of three candles: a bearish candlestick, a second candlestick with a small body that can be bullish or bearish, and a bullish candlestick.
When trading the Morning Star pattern, it’s important to keep in mind that the previous trend should have been downward.
Three White Soldiers Pattern
When a downtrend comes to an end and a bullish reversal is indicated, a bullish candlestick pattern known as the “three-white soldier’s pattern” appears. Three long, bullish candlesticks with short shadows that are green in color make up this pattern.

The strong buying pressure by the buyers indicates a reversal of the uptrend in this bullish candlestick pattern. In the pattern, all three candlesticks open inside the actual body of the candle that came before it.
Tweezer Bottoms Pattern
Tweeter bottoms are popular bullish patterns that are useful for trading equities as well as other assets. A bearish candle and a bullish candle, both of which should be about the same size, make up this straightforward pattern.

Both candles should have notable volumes, and the bullish one should open at the close of the bearish one. The bullish candle’s closing price ought to be equal to or higher than the bearish candle’s opening price.
At the bottom of a downtrend, this pattern is frequently observed. Given that the two candles’ sizes are comparable, it is likely that the bullish candle’s buying pressure equaled the selling pressure in the bearish candle. This indicates that the downward trend may end.
Bullish Harami Pattern
One prominent bullish reversal pattern that is sometimes thought of as the opposite of the bullish engulfing pattern is the bullish harami. Two candlesticks come together to form it: a big bearish candle and a small bullish candle.
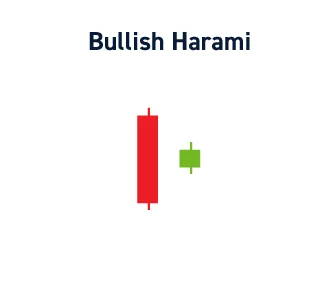
Because its open, close, high, and low will all fall inside the bearish candle’s range, the bullish candle should be small enough to “fit” inside the bearish candle. It is important to take this into account before trading this pattern.
Using tools like oscillators and market structure, you can verify the reversal when the bullish harami appears. Before making a trade, the majority of traders wait for the formation of a higher high, also known as a break in the market structure.
Dojis Pattern
Another name for Dojis is “indecision” candles. They have tiny candle bodies and resemble small to medium-sized candlesticks. The small candle body illustrates how sellers cannot drive prices lower and buyers cannot drive prices higher.
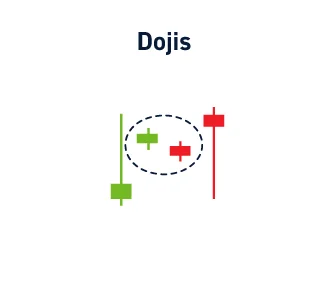
However, at critical points, the kind of doji that forms can be used to predict the most likely course for the price.
There are two types of Dojis;
- Gravestone Doji
- Dragonfly Doji
The gravestone doji is interpreted as a bearish reversal pattern, whereas the dragonfly doji is thought to be a bullish one.
The T-shaped candle represents the dragonfly doji. The candle featured a small or nonexistent upper wick and a long lower wick.
The lengthy wicks indicate the stock market’s rejection of a crucial level, as was previously mentioned.
This pattern frequently shows up at the base of a downward trend. When the Dragonfly reaches the crucial price point, the sellers find themselves in a strong demand or support scenario, and the buying pressure pushes the price back up. As a consequence, a T-shaped candle forms.
Conclusion: Bullish Candlestick Patterns
In the end, bullish candlestick patterns can help you predict price movement and, when used appropriately, can enhance your trading results, much like other price action strategies. However, there is no guarantee, so you should trade cautiously and with awareness of your risks. There are numerous options for patterns. Choose the one that speaks to you the most, then get to work on it right now!


