IDFC First Bank ₹590 Crore Fraud: What Really Happened

IDFC First Bank ₹590 Crore Fraud: What Really Happened 🔴 Breaking: Bank Fraud 2026 IDFC First Bank Fraud Case: How ₹590 Crore Vanished from a Single Branch — and What ...
Read moreCigarette Stocks Surge After Excise Duty Hike: Market Analysis 2026

Cigarette Stocks Surge After Excise Duty Hike: Market Analysis 2026 🚬 Cigarette Stocks Rally Despite Massive Excise Duty Hike: What Investors Must Know Indian cigarette stocks excise duty hike triggered ...
Read moreInfosys Anthropic AI Deal: Game-Changing Partnership for Indian IT

Infosys Anthropic AI Deal: Game-Changing Partnership for Indian IT 🚀 Infosys Anthropic AI Deal Reshapes Enterprise AI Landscape in India The Infosys Anthropic AI deal announced on February 17, 2026, ...
Read moreRBI Circular on Brokers 2026: New Lending Rules Explained

RBI Circular on Brokers 2026: New Lending Rules Explained
Read moreWhy IT Stocks Keep Falling: AI Disruption & Market Reality 2026
Why IT Stocks Keep Falling: AI Disruption & Market Reality 2026 The Real Reasons Why IT Stocks Are Falling Despite Strong Fundamentals Indian IT stocks are facing their worst phase ...
Read moreBudget 2026 India Highlights: Stock Market Impact & Tax Changes

Budget 2026 India Highlights: Stock Market Impact & Tax Changes Budget 2026 India: Complete Breakdown for Stock Market Investors Finance Minister Nirmala Sitharaman presented Union Budget 2026 on February 1, ...
Read moreIndia EU Trade Deal Auto Sector: Game-Changer or Overhyped?

India EU Trade Deal Auto Sector: Game-Changer or Overhyped? 🚗 India EU Trade Deal Auto Sector Impact: What Indian Investors Must Know Now The India EU trade deal auto sector ...
Read moreAlbinder Dhindsa New Eternal CEO: Leadership Shift Explained

Albinder Dhindsa New Eternal CEO: Leadership Shift Explained From Blinkit Founder to Eternal CEO: Albinder Dhindsa’s Strategic Ascent Albinder Dhindsa, the visionary founder and CEO of quick-commerce giant Blinkit, has ...
Read moreWhy You Should Avoid Hot Stocks India: The Hidden Trap Most Beginners Fall Into

Why You Should Avoid Hot Stocks India: The Hidden Trap Most Beginners Fall Into 🚨 The Hidden Trap: Why Smart Investors Avoid Hot Stocks India Every beginner investor in India ...
Read moreSector Rotation Strategy India: Smart Money Moves Bull Run
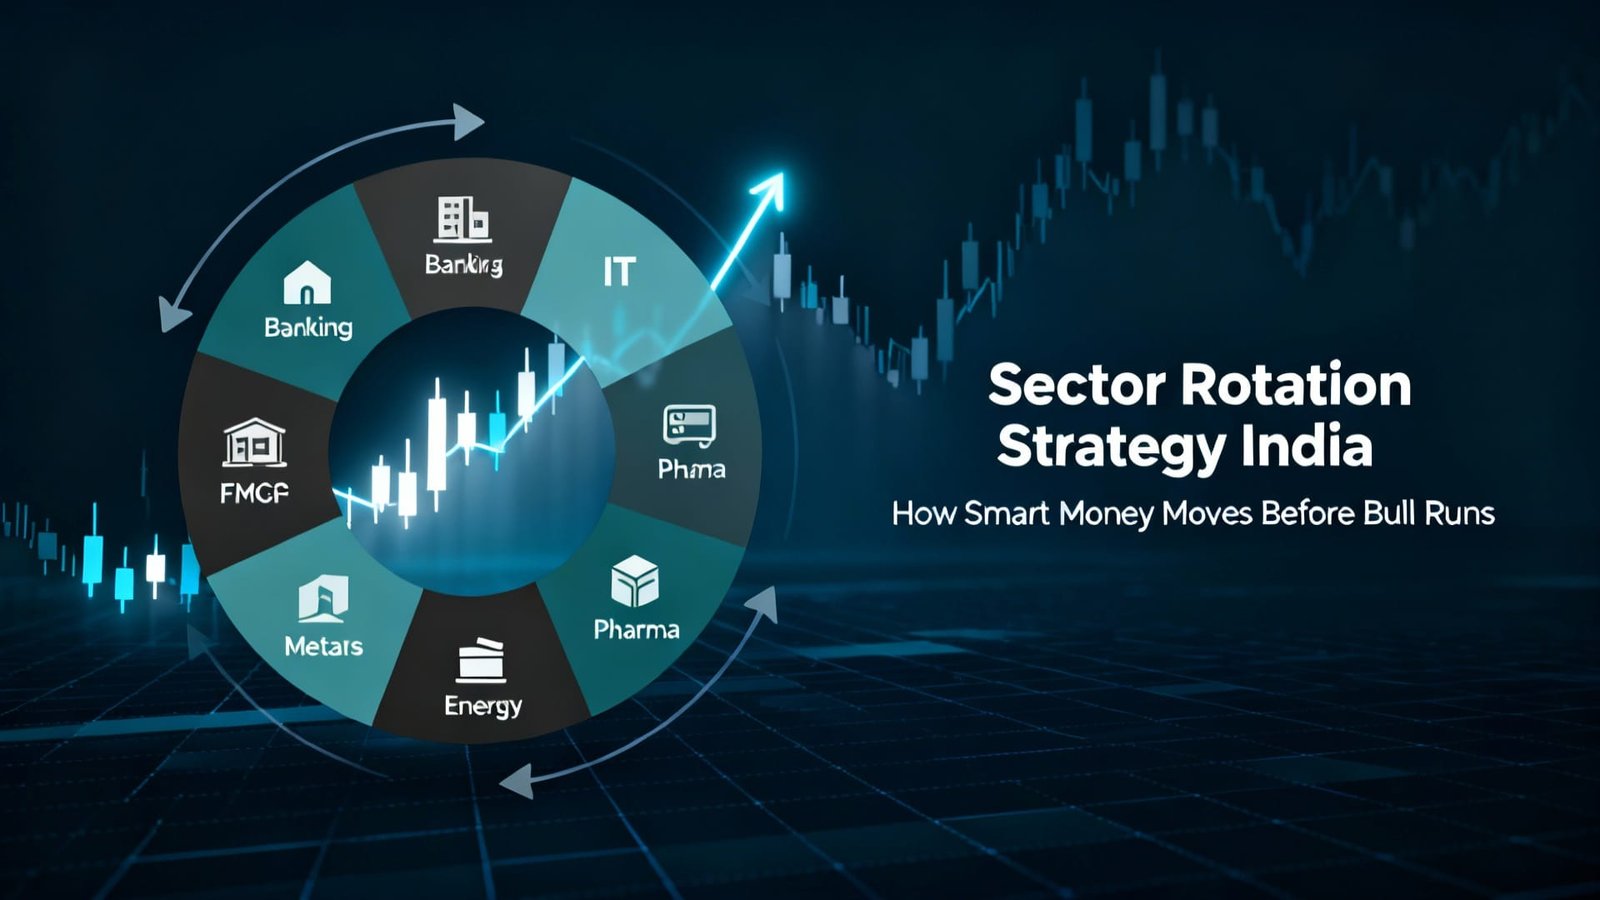
Sector Rotation Strategy India: Smart Money Moves Bull Run Understanding Sector Rotation Strategy India and Its Powerful Impact 📊 Sector rotation strategy India represents the systematic process of shifting investments ...
Read more